*1 From FY03/16, business contract fee calculation categorization changed.
FY03/2012
FY03/2013
FY03/2014
FY03/2015
FY03/2016
FY03/2017
Financial Position (Millions of yen)
YoY change
YoY change
YoY change
YoY change
YoY change
YoY change
Total assets
93,601
14,630
106,628
13,026
104,869
(1,758)
110,316
5,447
92,478
(17,838)
80,397
(12,080)
Total net assets
51,555
4,533
55,098
3,543
58,753
3,654
60,246
1,493
58,291
(1,954)
43,227
(15,064)
Shareholders’ equity
51,071
4,291
54,559
3,487
58,279
3,720
59,492
1,212
57,304
(2,188)
42,225
(15,078)
Interest-bearing liabilities
1,662
(172)
1,052
(609)
743
(308)
4,065
3,321
11,423
7,357
15,489
4,066
Cash Flows (Millions of yen)
YoY change
YoY change
YoY change
YoY change
YoY change
YoY change
Cash flows from operating activities
10,015
2,010
13,570
3,554
16,322
2,752
(9,086)
(25,408)
13,353
22,439
(7,319)
(20,673)
Cash flows from investing activities
(4,798)
(441)
(6,263)
(1,465)
(8,018)
(1,754)
(6,297)
1,720
(2,191)
4,106
(3,927)
(1,735)
Cash flows from financing activities
(2,565)
1,349
(2,277)
288
(2,018)
258
1,624
3,643
5,214
3,590
2,136
(3,077)
Free cash flow
5,217
1,568
7,307
2,088
8,303
997
(15,384)
(23,687)
11,162
26,546
(11,246)
(22,408)
Per share data (JPY)*2
Net income
180.45
142.27
161.83
90.97
3.58
(376.19)
Total net assets
1,539.04
1,644.15
1,756.27
1,792.83
1,726.88
1,272.48
Dividends per share
50
50
50
60
50
50
Key Financial Indicators (%)
Return on equity (ROE)
12.2
8.9
9.5
5.1
0.2
(25.1)
Return on assets (ROA)
10.0
10.3
9.2
5.1
1.4
(10.5)
Shareholders’ equity ratio
54.6
51.2
55.6
53.9
62.0
52.5
*2 October 1, 2012, a stock split at a ratio of 100 shares for each common share was executed, thus the retroactive calculation takes into account this stock split retroactively.
From here, key financial indicators (consolidated) can be viewed in the chart generator.
Business performance in FY03/17 was as follows. In particular, our business results were impacted by regulation in the pachinko and pachislot field and postponement of titles scheduled for launch to the next fiscal year and later.
Results of Operations (Millions of yen)
FY03/2016
FY03/2017
FY03/2018
Full-year
YoY change (%)
Full-year
YoY change (%)
Full-year forecast
YoY change (%)
Net sales
94,476
(5.1)
76,668
(18.8)
82,000– 85,000
7.0– 10.9
Gross profit
25,480
(10.5)
17,641
(30.8)
As a percent of sales
27.0%
23.0%
Operating income
1,411
(70.4)
(5,374)
–
1,000– 2,000
–
As a percent of sales
1.5%
–
Ordinary income
1,380
(74.9)
(9,068)
–
0– 2,000
–
As a percent of sales
1.5%
–
Net income attributable to owners of parent
118
(96.1)
(12,483)
–
0– 1,000
–
As a percent of sales
0.1%
–
Total Assets, Liabilities and Net Assets
Total assets decreased ¥12,080 million from the end of the previous fiscal year to ¥80,397 million. This was due mainly to a decrease in cash and cash equivalents, resulting in an ¥7,077 million decrease in total current assets from the end of the previous fiscal year.
Total liabilities rose ¥2,983 million from the end of the previous fiscal year, to ¥37,170 million. This was mainly due to the decrease in short-term borrowings in current liabilities and the increase in long-term borrowings in fixed liabilities resulting from the implementation of fund procurement in line with business.
Total net assets decrease shrank ¥15,064 million from the end of the previous fiscal year, to ¥43,227 million. This was due mainly to a ¥14,142 million decrease in retained earnings from the end of the previous fiscal year.
(Unit: Millions of yen)
At March 31, 2016
At March 31, 2017
Increase/Decrease
Total current assets
52,934
45,856
(7,077)
Tangible fixed assets
11,447
10,366
(1,081)
Intangible fixed assets
3,746
2,469
(1,277)
Investments and other assets
24,348
21,705
(2,643)
Total assets
92,478
80,397
(12,080)
At March 31, 2016
At March 31, 2017
Increase/Decrease
Total current liabilities
29,809
20,475
(9,334)
Total fixed liabilities
4,376
16,694
12,318
Net assets
58,291
43,227
(15,064)
Total liabilities and net assets
92,478
80,397
(12,080)
Cash Flows
Net cash expenditure in operating activities amounted to ¥7,319 million, compared with ¥13,353 million provided by operating activities in the previous fiscal year. This was mainly due to a loss before income taxes and minority interests of ¥10,517 million, an increase in notes and accounts receivable—trade of ¥5,249 million, and an equity method investment loss of ¥3,866 million.
Net cash expenditure in investment activities amounted to ¥3,927 million, compared with ¥2,191 million in the previous fiscal year. This was mainly due to expenditure for loans totaling ¥4,640 million, proceeds from repayments of loans totaling ¥2,037 million, and expenditure for equity investment totaling ¥969 million.
Net cash provided in financing activities amounted to ¥2,136 million, compared with ¥5,214 million provided by financing activities in the previous fiscal year. This was mainly attributable to proceeds from long-term borrowings totaling ¥15,500 million, a decrease in short-term borrowings of ¥11,133 million, and dividends paid totaling ¥1,659 million.
As a result, free cash flows was negative ¥11,246 million.
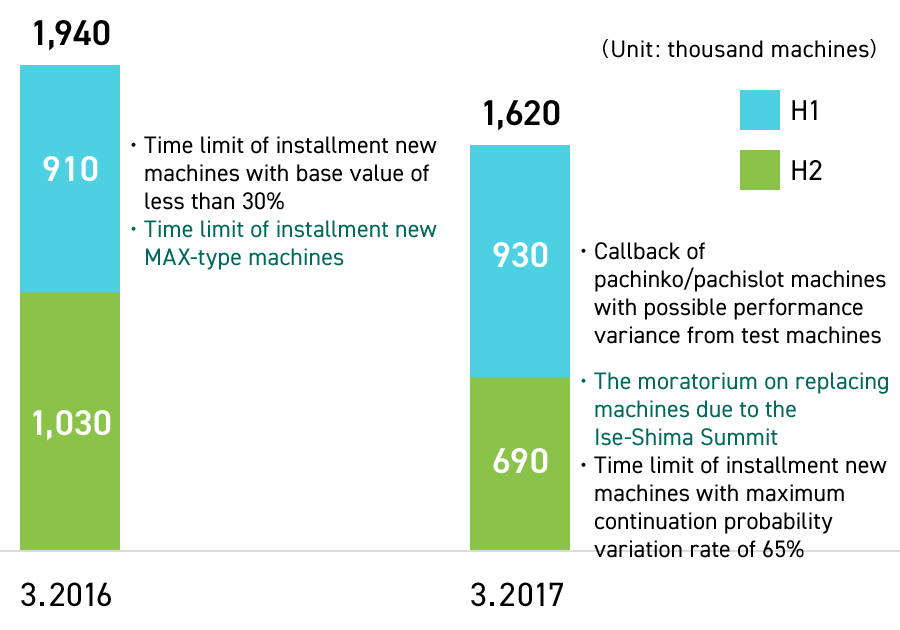
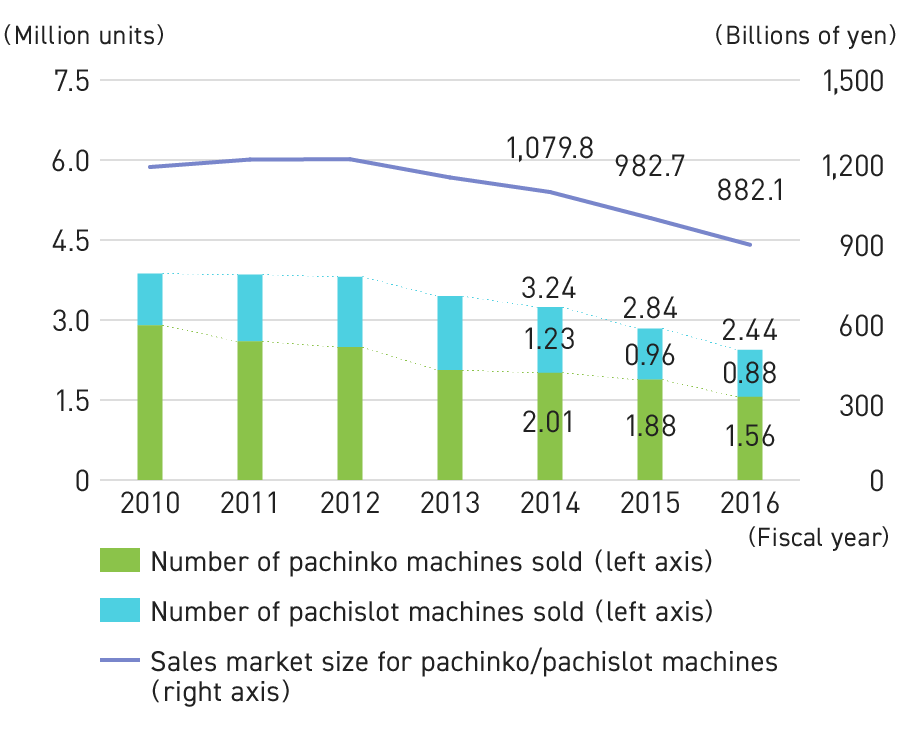
The market for pachinko and pachislot field is continuously shrinking, due to a series of regulations triggered by changes in the model certification test method for pachislot machines in September 2014. In first half of fiscal 2016, the pachinko and pachislot machines market felt the impact of regulations, as well as from the moratorium on replacement of machines during the G7 Ise-Shima Summit in May 2016, and as a consequence, the number of pachinko and pachislot machines sold fell when compared to the same period of the previous year. During the second half of the period, demand for replacement of pachinko machines rose during the October–December period as the December 2016 deadline approached for removing “pachinko machines with possible performance variance from test machines,” and despite the subsequent downturn in demand during the January–March period, the number of machines sold in the pachinko market was steady when compared to the same period of the previous year. With pachislot machines, although there was a certain demand for proven machine series, there is some way to go before the machines on offer fully meet customer needs. Consequently, there was a downward trend in the number of machines sold during the second half of the fiscal year. As a result, total sales of pachinko and pachislot machines in fiscal 2016 were approximately 2.48 million units (*according to the Company), down about 15% from the same period of the previous year.
Number of the pachinko machine sales in PS market
*Machines sales in the market: FY03/2016-FY03/2017
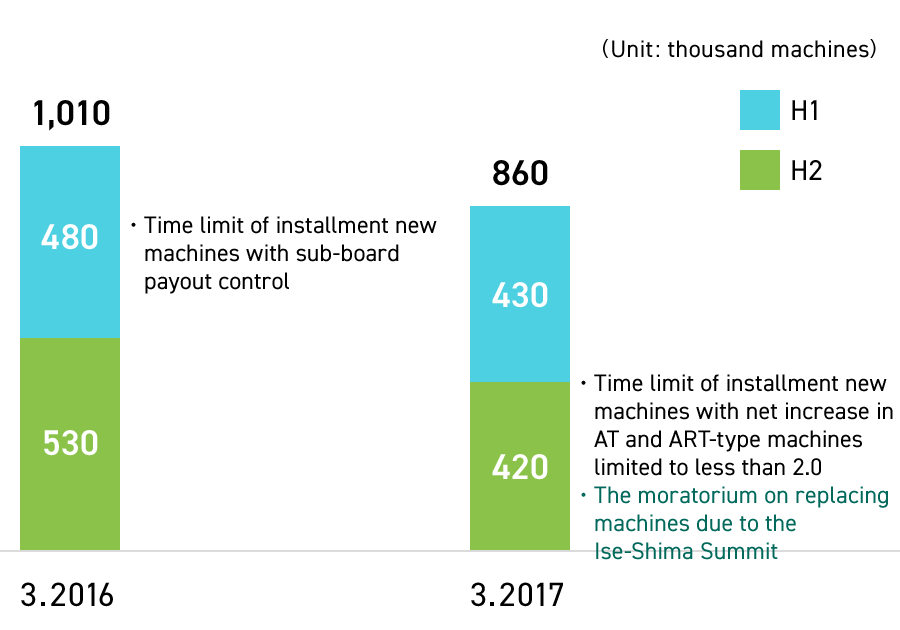
Number of the pachislot machine sales in PS market
*Machines sales in the market: FY03/2016-FY03/2017
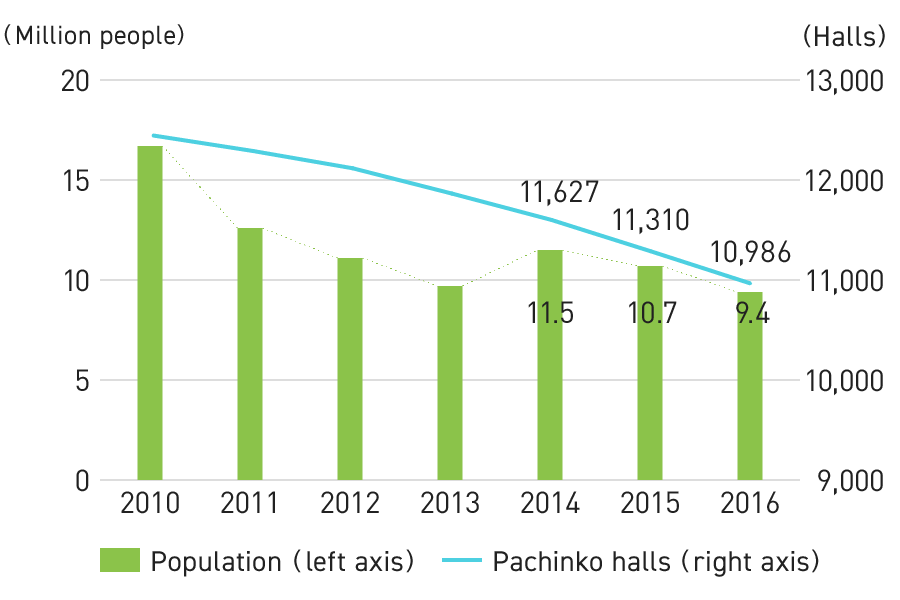
According to the Japan Productivity Center’s White Paper on Leisure 2017, the number of people (estimated) that played pachinko and pachislot in 2016 shrank by 1.3 million people from the previous year to 9.4 million people, falling below 10 million people for the first time since 2013.
Trends the Playing Population/Changes the Number of Pachinko Halls
Source:
White Paper on Leisure 2017, Japan Productivity Center; 2016 White Paper on Adult Entertainment Businesses, National Police Agency.
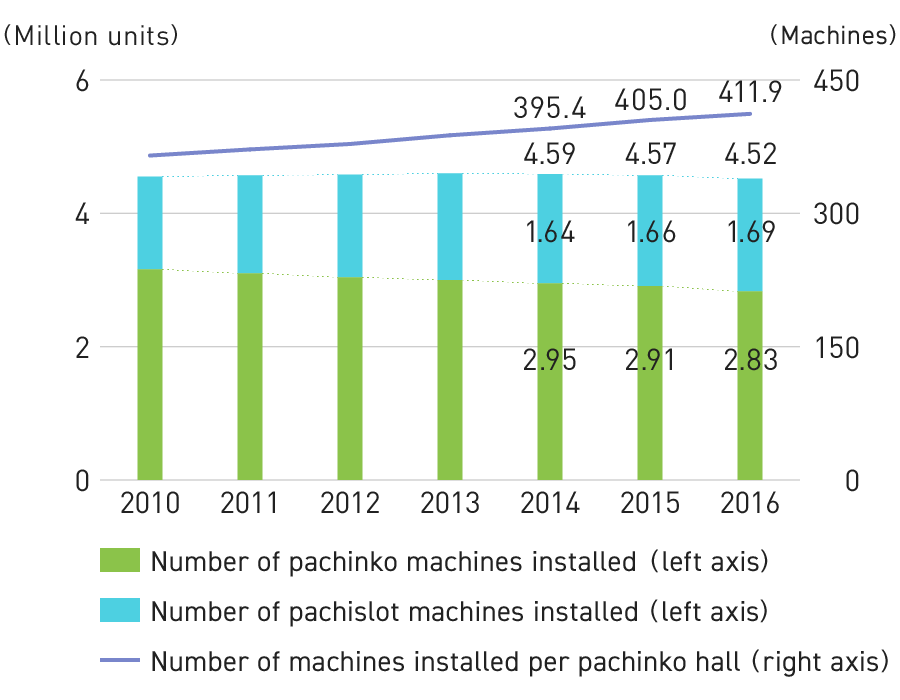
Trends in Number of Pachinko Halls and, Pachinko and Pachislot Machines Installations
Statistical data released by the National Police Agency (NPA) indicates that the number of pachinko halls in Japan decreased by 324 YoY, to 10,986 in 2016. Although the number of installed machines decreased by approximately 50,000 YoY to 4.52 million machines, the number of machines installed per hall increased by 6.9 machines to 411.9 machines, indicating continuation of the trend for larger halls.
Changes in Number of Pachinko and Pachislot Machine Installations
Source:
2016 White Paper on Adult Entertainment Businesses, National Police Agency.
Trends in Pachinko and Pachislot Machine Sales
According to Yano Research Institute, Ltd’s Pachinko Maker Trends 2017, pachinko machine sales were down 16.9% YoY, to 1.56 million units in 2016. Pachislot machine sales down 8.4% YoY, to 880,000 units. As a result, the total sales market for pachinko and pachislot machines down 10.2% YoY, to ¥882.1 billion, with the pachinko market down 14.4% YoY, to ¥524.5 billion, and the pachislot market down 3.3%YoY, to ¥357.6 billion.
In September 2014, changes made to the model certification test method of pachislot machines triggered a series of voluntary regulations by industry bodies, which resulted in revisions of the development and sales schedules for various manufacturers. This has been a significant variation factor.
Changes in Pachinko and Pachislot Machine Sales
Source:
Pachinko Maker Trends 2017, Yano Research Institute, Ltd
In this market environment, we sold 15 titles under 7 brands and strived to expand sales, with a focus on major titles targeting the New Year holiday shopping season, during which demand was expected to increase. 2 of the major titles released in December demonstrated steady sales. Another title released in January was coupled with multimedia expansion, including not only the creation of pachinko and pachislot machines but also visual adaptation, resulting in additional orders being received immediately after their installation. Moreover, the number of machines sold per title continued to exceed the market average, owing mainly to the Group’s strength in marketing.
However, orders were sluggish for some of the pachislot titles released in the January–March period due to the effects of a slump in demand. In addition, as stated in the “Notification of Revisions to Performance Forecast,” announced on January 20, 2017, the release of 6 titles, which had been scheduled for this period, was postponed to at least the next period. As a result, the number of pachinko machines sold was 155,000 units (down 6,000 units from the previous year), pachislot machine sales totaled 87,000 units (down 38,000 units), and the total sales volume was 243,000 units (down 45,000 units).
In the future, we will strive to strengthen our distribution base, expand the products we handle based on the Medium-Term Management Plan announced in May 2017, and develop a lineup for stable product supply throughout the year. In addition, we will build a business structure that will not be affected by changes in the market environment, and will focus on providing pachinko and pachislot solutions.
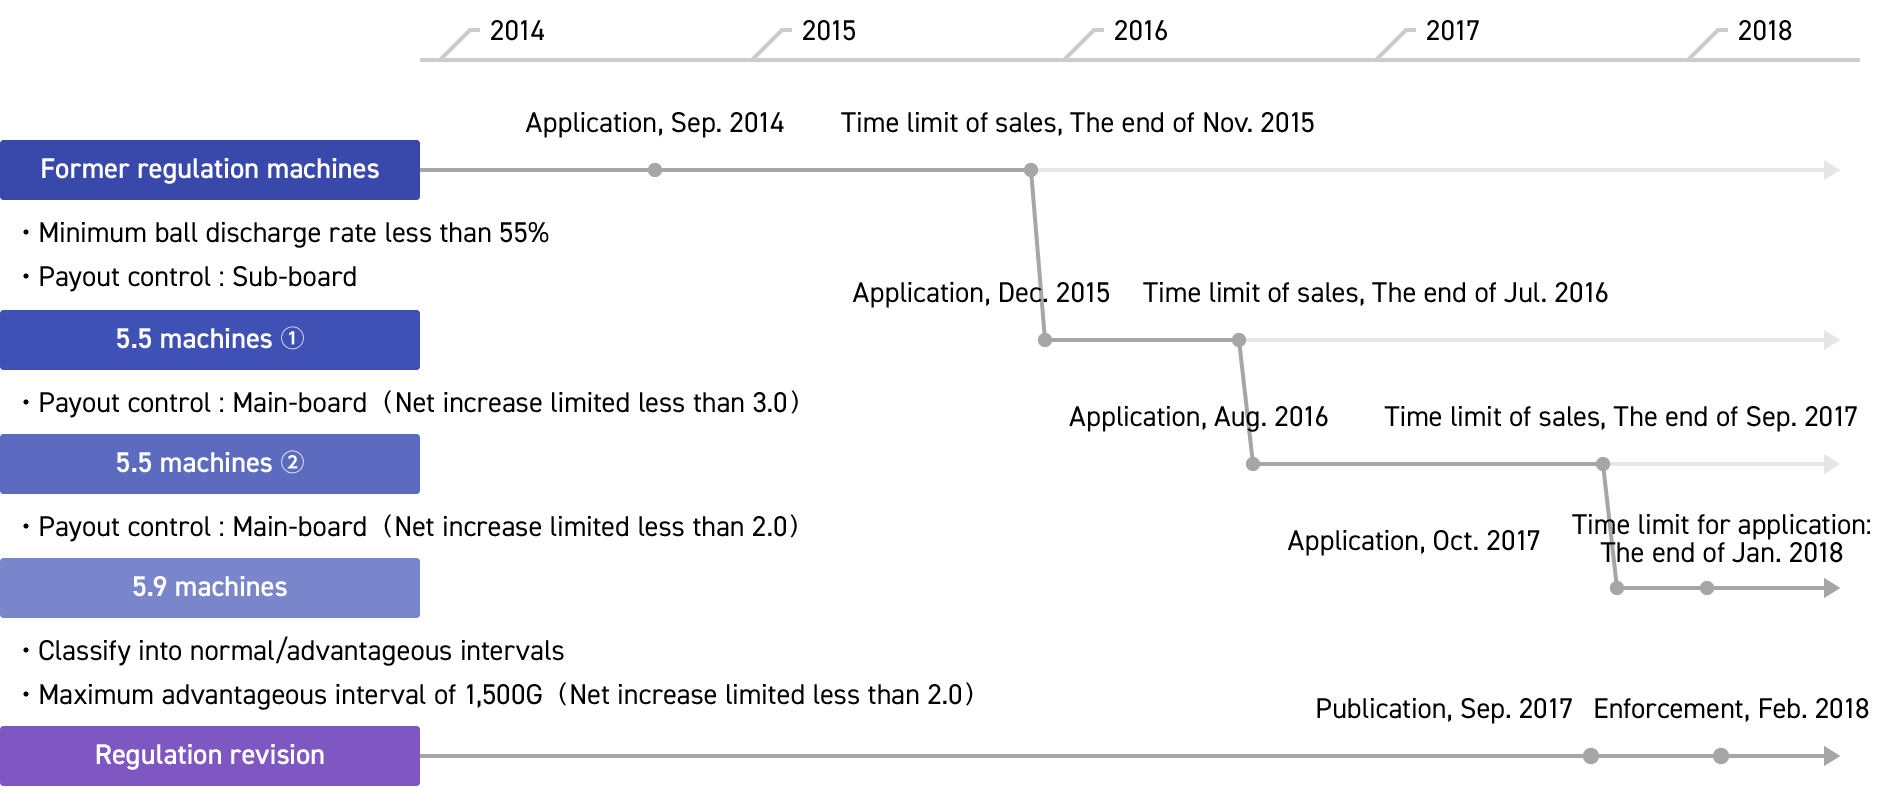
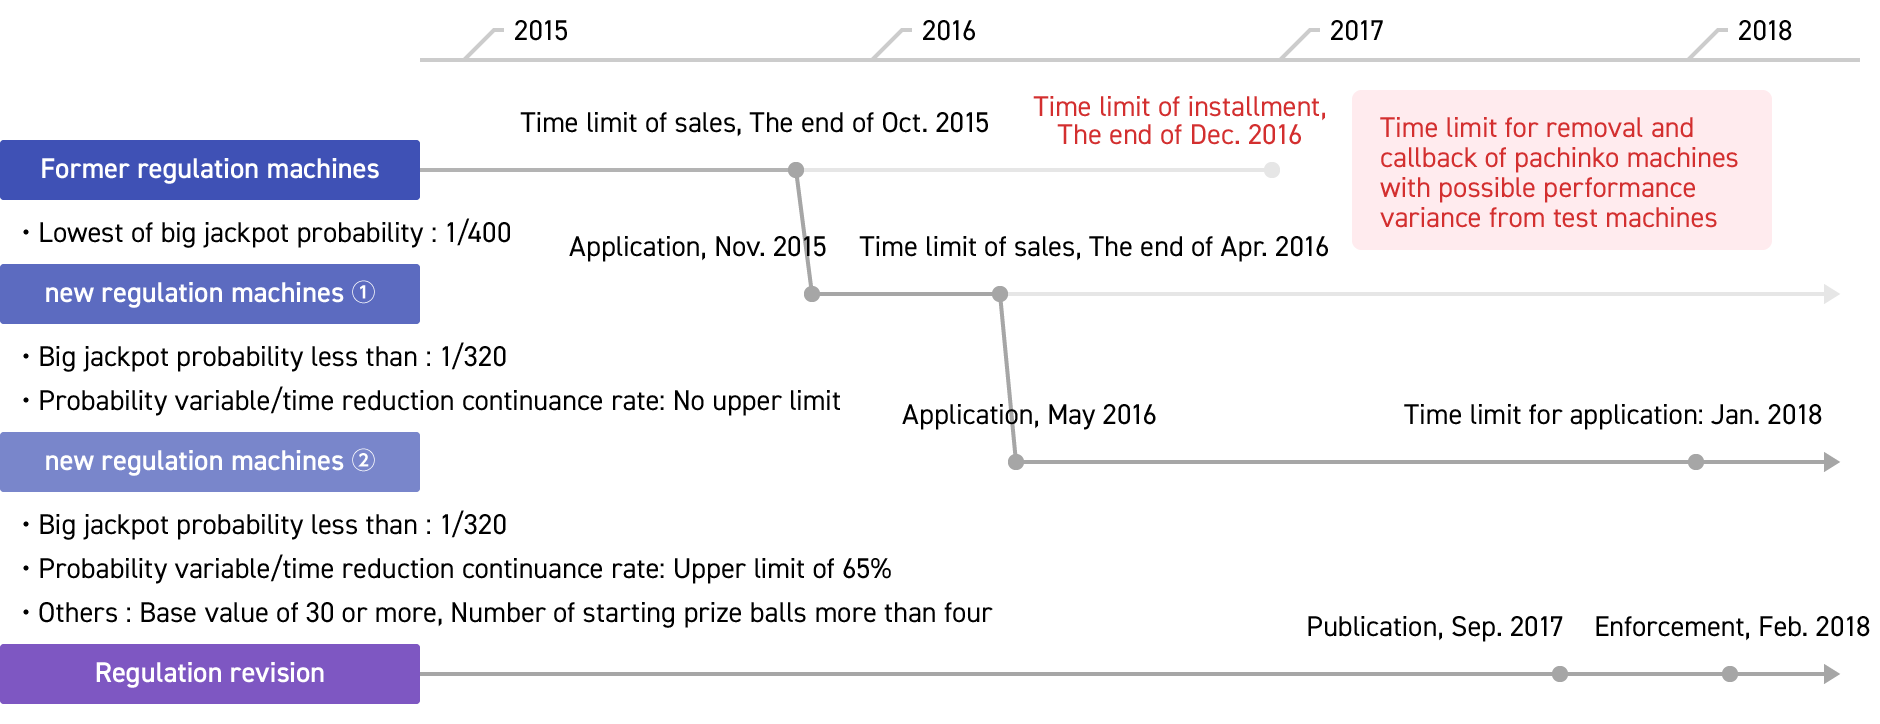
Explanation of Recent Pachinko and Pachislot Market Regulations and Other Developments
In August 2014, the National Police Agency (NPA) informed industry bodies of partial changes in the model certification test method for pachislot machines. Along with this, several announcements were made by industry bodies pertaining to pachislot machine specifications requiring design reviews in multiple areas. About this time, in March 2015, industrial bodies announced “initiatives to restrict gambling” affecting pachinko machines.
Consequently, with a sales deadline for old standard pachinko and pachislot machines, the market became confused, seeing a sharp decline in test conformance, convergence of sales due to the sales deadline, and a sharp drop in sales immediately following the deadline.
On July 11, 2017 the National Police Agency announced the “Draft Regulation Partially Amending the Ordinance for Enforcement of the Act on Control and Improvement of Amusement Business, etc. and the Regulations for the Verification of Licenses, Formats and Other Aspects of Pachinko and Pachislot Machines,” including pachinko payout regulations. This is expected to come into force on February 1, 2018.
Given these circumstances and future market forecasts, FIELDS intends to build a business foundation that will not be affected by changes in the market environment. Consequently, we are working on various measures such as reinforcing our distribution base, which is our strength, boosting relationships with partner manufacturers, and expanding our handled products. In addition, the FIELDS CORPORATION GROUP is planning to temporarily reduce the speed of investment in private brands.
Pachislot Regulatory Trends
Pachinko Regulatory Trends
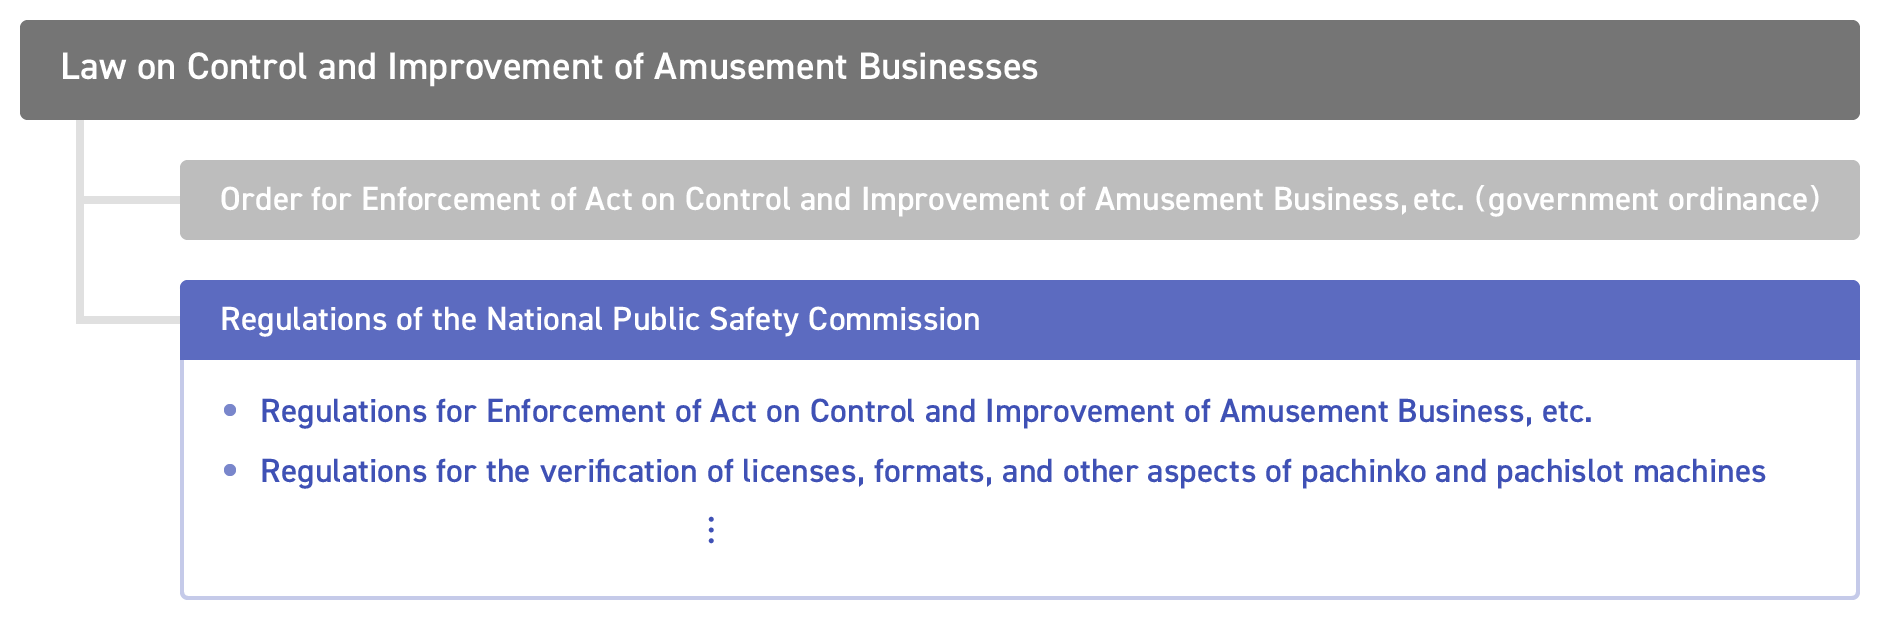
Structure of related laws and regulations
Game
In the game field, there was a conspicuous slowdown in growth in the social games market in Japan, caused by increasing competition. Development and operating costs have continued upward due to the increased functionality of smartphones.
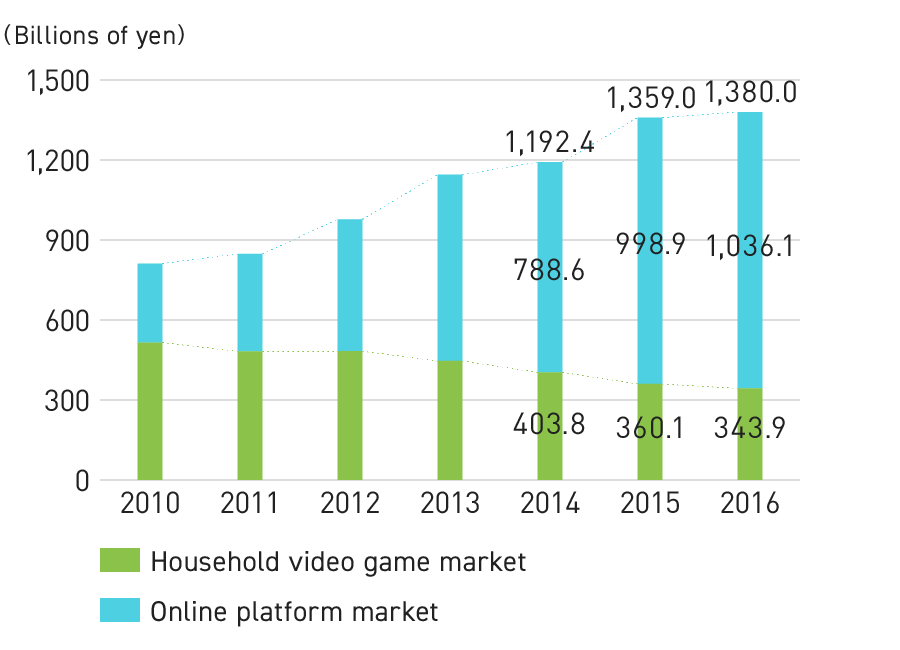
The Famitsu Game White Paper 2017 by Gzbrain Inc. states that the household game market decreased 4.5% YoY to ¥343.9 billion (total of game hardware and software) in 2016.
Meanwhile, the online platform game market (game apps for smartphones/tablets, games for feature phones, and online PC games) increased 3.7% YoY to ¥1,036.1 billion. As a result, the size of the game market in Japan reached a record-high of ¥1,380.0 billion, increased 1.5% YoY.
Within the online platform game market, the size of the game app market (game apps for smartphones/tablets for games on SNS platforms for feature phones) increased 4.4% YoY to ¥969.0 billion, accounting for approximately 70% of the domestic game market and helping to drive its expansion.
Changes in Scale of Game Market in Japan
Source:
White Paper on Famitsu Games 2017, Gzbrain Inc.
*Numerical values of less than ¥100 million have been rounded down.
Scale of Overseas Game Content Market
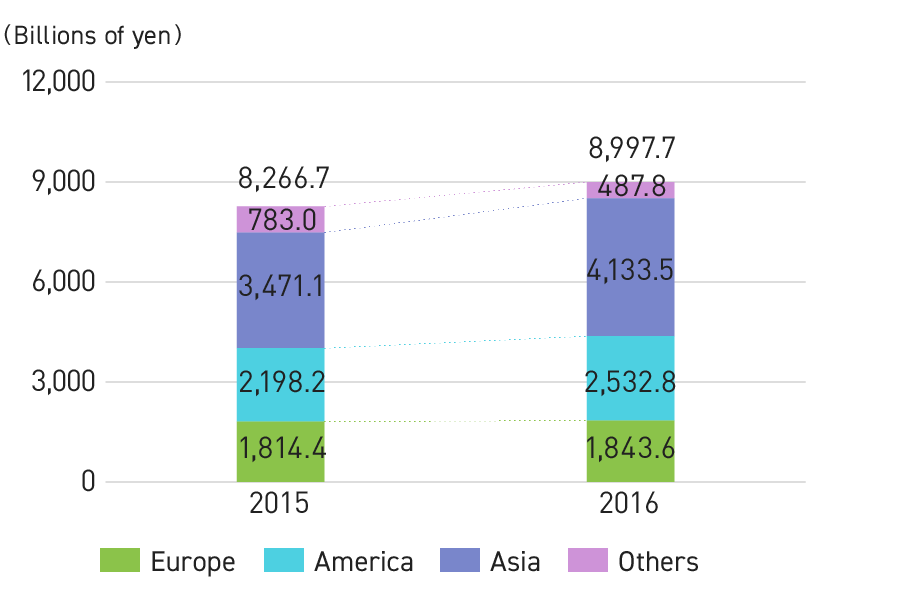
According to the Famitsu Game White Paper 2017 of Gzbrain Inc., the overseas game content market was ¥8,997.7 billion (up 8.8% YoY) in 2016.
The breakdown of this shows that the packaging market for PCs and console games was ¥1,153.1 billion, and digital sales market for mobile, PC, and console games grew by more than 10% to ¥7, 844.5 billion.
By region, the Asian market was ¥4,133.5 billion (up 19.1% YoY), U.S. was ¥2,532.8 billion (up 15.2% YoY), and Europe was ¥1,843.6 billion (up 1.6% YoY).
*Asia: total for Japan, China, and Korea
*Europe: total for countries in Western, Central, and Eastern Europe.
Aggregate total for the UK, Germany, France, Spain, Italy, Scandinavia, and Benelux region, for household packages only.
*In some areas, the countries and regions included in calculations may differ from 2015 to 2016.
Scale of Overseas Game Content Market
Source:
White Paper on Famitsu Games 2017, Gzbrain Inc.
In FY03/17, social games titles using leading IP, such as AKB48, continued to contribute to the Group’s earnings. Meanwhile, the delay in the release of new titles, termination of service for 3 existing titles, and the suspension of development of some consumer games due to business selection and focus resulted in earnings falling below those of the same period of the previous year.
Based on the Medium-Term Management Plan, FIELDS will promote global game development and game content development utilizing overseas game engines, in coordination with domestic and overseas partner companies, starting from IP that can be organized in the medium- to long-term, and we will attempt to monetize them.
Visual
In the visual field, with the rise of new platforms including SVOD (Subscription Video On Demand), it is anticipated that the market will expand remarkably both in Japan and overseas.
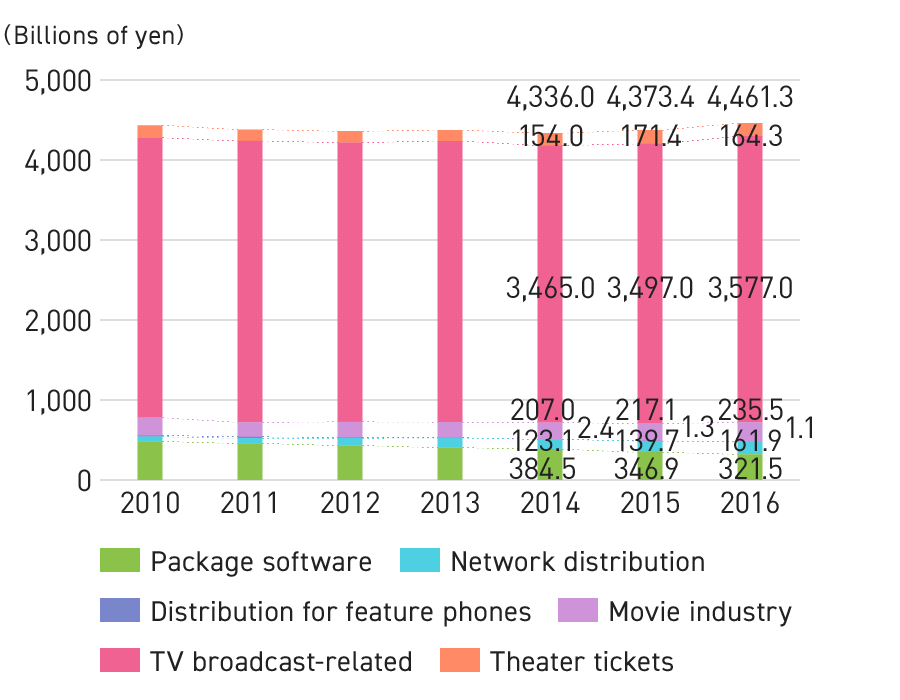
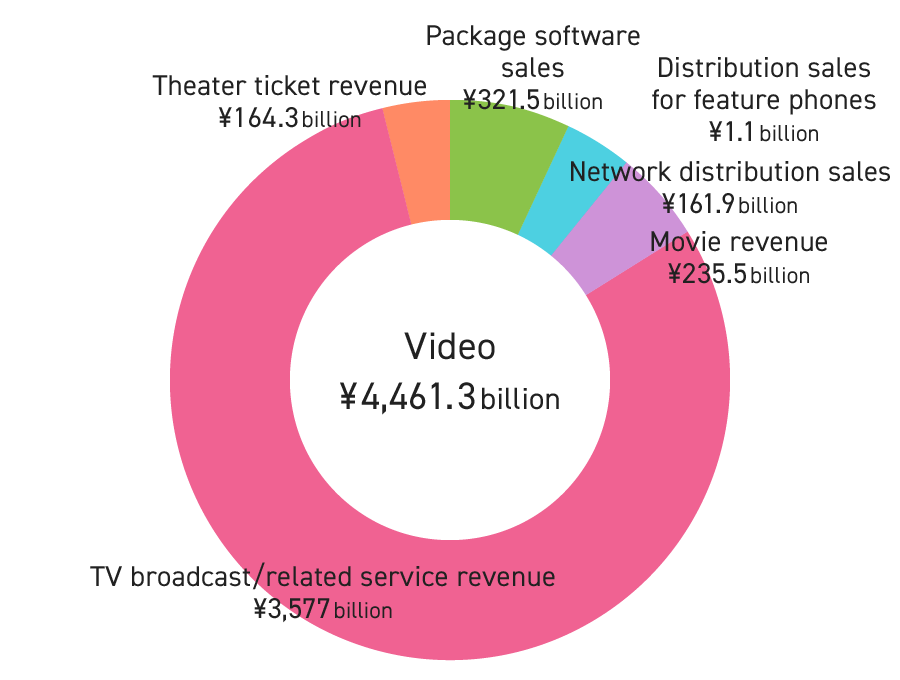
According to the White Paper on Digital Content 2017 by the Digital Content Association of Japan, the video market in 2016 increased by 2.0% YoY to ¥4,461.3 billion. This was due to increases in network distribution, movie and TV broadcast-related products. Package software continued to decrease.
Network distribution (excluding that for feature phones) increased greatly by 15.9% YoY to ¥161.9 billion, exceeding the DVD rental market for the first time. In the video network distribution field, due to the popularization of smartphones and tablets with the appearance of LTE (next-generation high speed mobile phone distribution standards) and 4G after 2010, new mobile phone carriers have entered the market and the conversion of contents to multiple devices has advanced. In addition, prices for contents have been lowered and fixed, and the range of contents has expanded as a result of efforts by the contents industry. Therefore, the market has expanded its field from core fans of video contents to include light fans.
In 2016, continuing on from last year, the entry of overseas SVOD (Subscription Video On Demand) distribution corporations into the Japanese market has led to increased choices for users of video content due to the appearance of live distribution services and free video services with advertising. Thus, the market has continued to expand.
Trends in Video Market
Source:
White Paper on Digital Content 2017, published by the Digital Content Association of Japan.
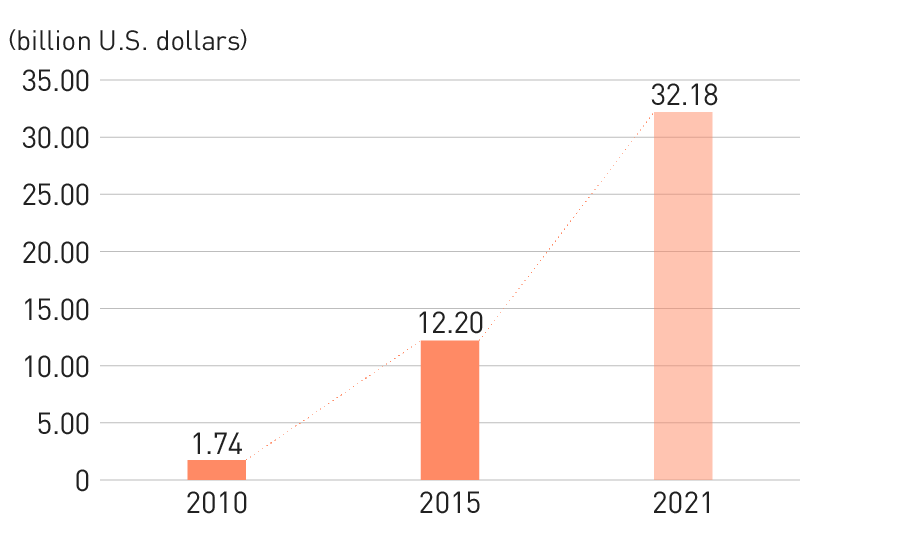
Global SVOD Market Forecast
Source:
Digital TV Research
In FY03/17, we collaborated with powerful businesses in the entertainment industory and SVOD operators in the United States and other countries in the launch of visuals for seven IP, including the full-3D CG animation GANTZ:O, MAJESTIC PRINCE THE MOVIE, and TV anime ACTIVERAID - Special Public Security Fifth Division Third Mobile Assault Eighth Unit -, and BERSERK. As a result of promoting multiple visual projects, there was an increase in the visual-related amortization expense, plus an increase in production expenses for certain large projects undertaken by affiliates, leading to the recording of a temporary loss.
Moving forward, we will develop collaborative productions with United States and Chinese visual distributors and advance global development, based on the Medium-Term Management Plan. In addition, we will promote merchandising in the global market, using visuals as a hook, and utilize digital data of visuals to implement cross-media development such as games, and pachinko and pachislot machines, in conjunction with each business platform.
Licensing
In the license field, there has been a flurry of movement across the market to open up new opportunities both in Japan and overseas, such as the new usage of popular characters and licensing such characters in apparel for adults.
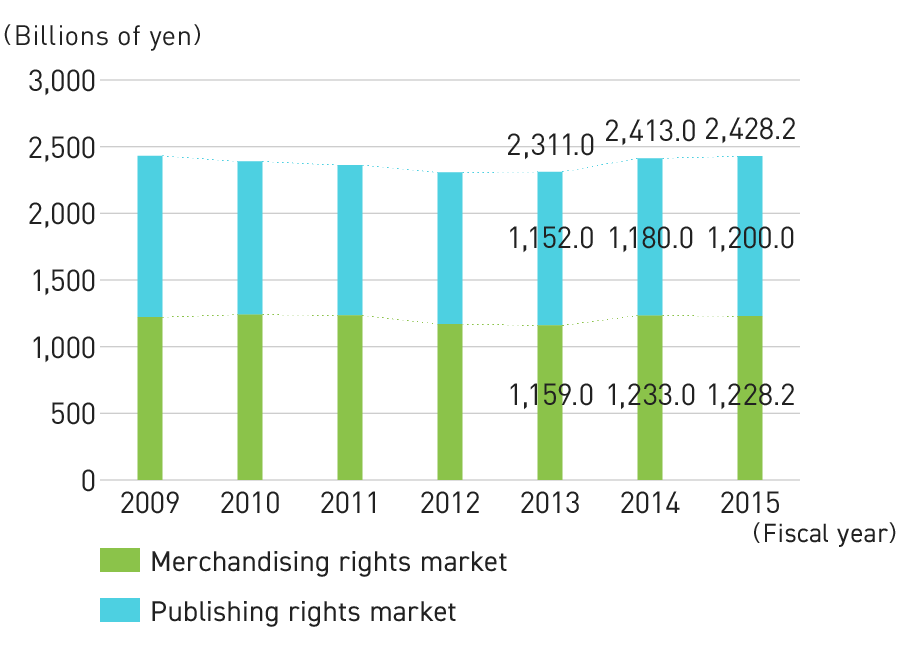
According to Yano Research Institute, Ltd’s Licensed Character Business in Japan: Key Research Findings 2016, in fiscal 2015 the character business market amounted to ¥2,428.2 billion (up 0.6% YoY), up slightly but remaining mostly flat.
Toys, which account for a major share of the merchandise licensing market, struggled causing overall contraction. However, apparel and fashion accessories that promote the strengthening of products for adults performed well due to the success of efforts related to apparel worn by fashion models featuring characters from animation and other entertainment.
The copyrights market expanded significantly due to the enhanced rebranding of classic characters and the aggressive use of characters in sales promotions.
Trends in Character Business Market
Source:
Yano Research Institute, Ltd’s Licensed Character Business in Japan: Key Research Findings 2016
Merchandising rights: The right to use characters for ancillary products. Calculated on a retail sales amount basis.
Copyrights: The right to use character images in published materials and advertising. Calculated on a contract amount basis.
In FY03/17, we strengthened collaboration with leading companies in various business fields to expand the scope of the IP business and to establish a new licensing business. In addition, the Group promoted activities to establish partnership mainly in Asia, aiming to find market opportunities overseas. These efforts led to an increase in royalty revenue from the licensing of Ultraman series and other IP compared to the same period of the previous year.
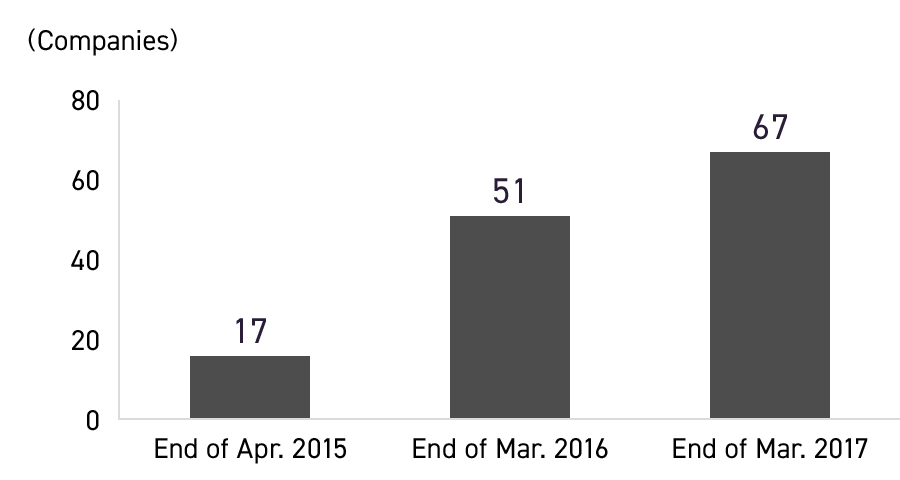
In addition, A Man of Ultra, a conceptual license launched in 2015, won the Japan Brand License Award in June 2016, and we intend to accelerate its expansion further in the future.
A MAN of ULTRA: change in the number of license companies
Based on the Medium-Term Management Plan, we will make effective use of “Ultraman” IP not only in Japan, but also promoting partnerships with companies in Asia including China, and will also aim to expand license income in various media, such as games and merchandising.
Comic
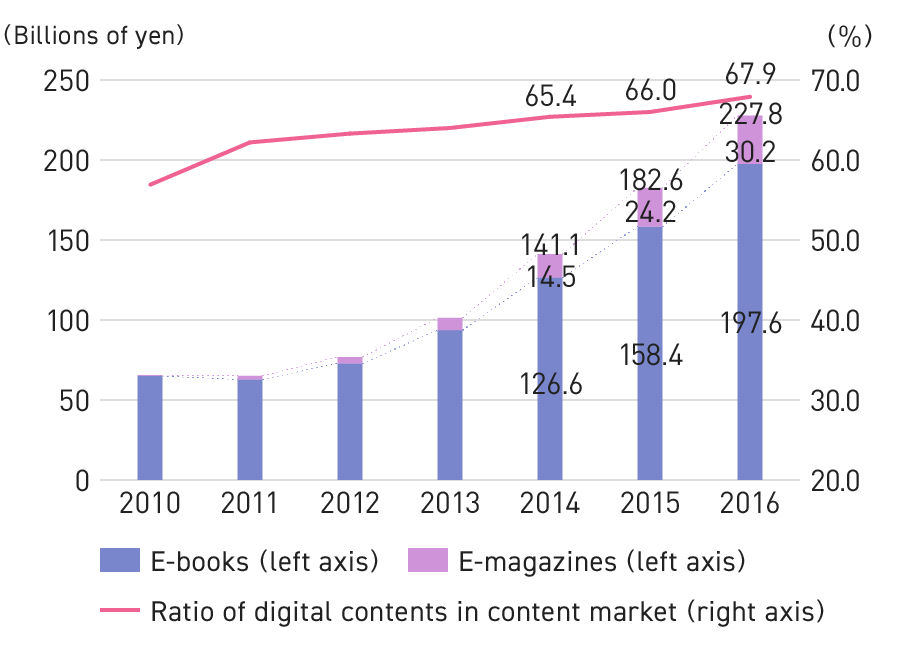
In the comic field, the e-book market leveraging devices such as smartphones and tablet PCs is expanding steadily through popularization of subscription all-you-can-read services, while the market size for published materials, such as books and magazines, is shrinking.
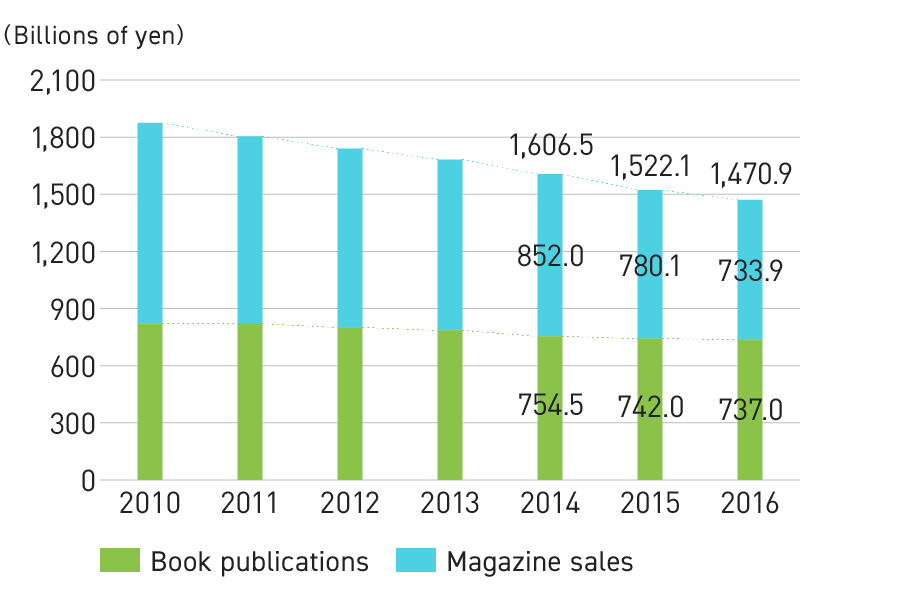
According to the White Paper on Digital Content 2017 by the Digital Content Association of Japan, book sales in 2016 decreased by 0.6% YoY, to ¥737.0 billion. Thus, the decreasing trend continued. Magazine sales also fell below book sales, decreasing for the 19th consecutive year by 5.9% YoY, to ¥733.9 billion.
In recent years, the digitalization of the content market has progressed, with the digital ratio increasing by 1.9% YoY, reaching 67.9% in 2016. With this, large increases continued to be observed for e-books (increase of 24.7% YoY, to ¥197.6 billion) and e-magazines (increase of 24.7% YoY, to ¥30.2 billion).
Trends in Publishing Market
Trends in E-book/E-magazine Market
Source:
White Paper on Digital Content 2017, Digital Content Association of Japan.
In FY03/17, we began serialization of 4 new works through HERO'S Monthly comic magazine, bringing the total number of created works to 71. In addition, we have promoted a project for creation of visuals from the hero’s IP created in this comic, including TV anime and SVOD services. In October 2016, we began distribution of an official app Comic HERO’s. In addition, we promoted diversification of distribution methods in the e-book platform, and developed e-books and books in 11 languages in 24 countries and regions.
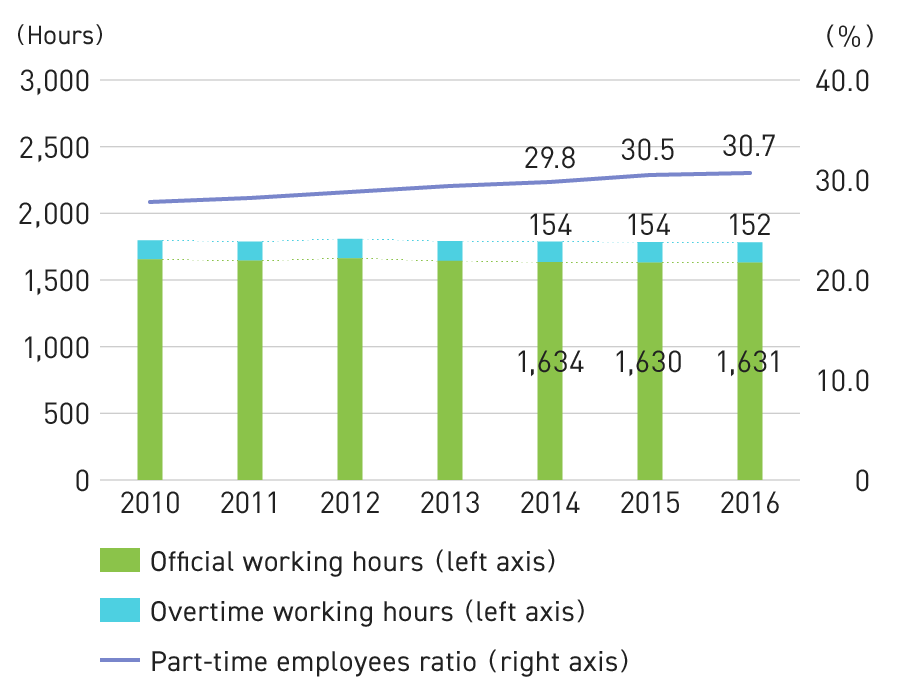
According the Monthly Labor Survey of the Ministry of Health, Labor and Welfare, the annual total actual hours in 2016 worked in Japan (at establishments with 30 employees or more) was 1,783 hours (1 hour decrease compared with the previous fiscal year), marking the 4th consecutive year of decrease.
Official working hours were 1,631 hours, (up 0.0% YoY), remaining mostly flat since the previous year. Meanwhile, overtime working hours were 152 hours (down 1.7% YoY), which was a small drop from the previous year. The ratio of part-time workers continues to increase, leading to a decrease in working hours for employees overall.
Note: In some cases, the calculation of YoY changes and indices do not match actual calculation figures. Also, index number and YoY changes have been retroactively revised in accordance with changes in sampling by the research office in January 2015. As a result, some of the YoY comparison calculations in the graph are incongruent with actual figures.
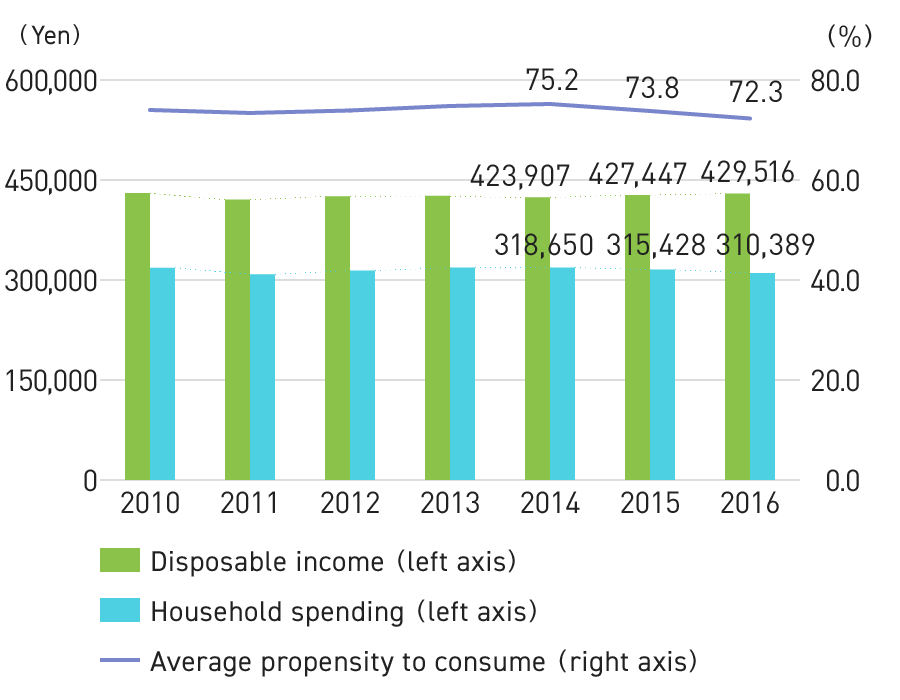
According to the Family Income and Expenditure Survey conducted by the Ministry of Internal Affairs and Communications, disposable income per household for employees in 2016 was ¥429,516 (0.5% increase compared with the previous fiscal year, an increase of ¥2,069).
However, household spending (monthly, averaged over one year) in 2016 was ¥310,389 (down 1.6% YoY), marking the 3rd consecutive year of decrease. This was due mainly to the impact of the unseasonal weather on the summer market.
Average propensity to consume (percentage of the household spending for the disposable income) was 72.3% (down 1.5 point), marking the 2nd consecutive year of decrease.
Note: Some of the YoY comparison calculations in the graph are incongruent with actual figures due to the consideration of price fluctuations in actual figures.
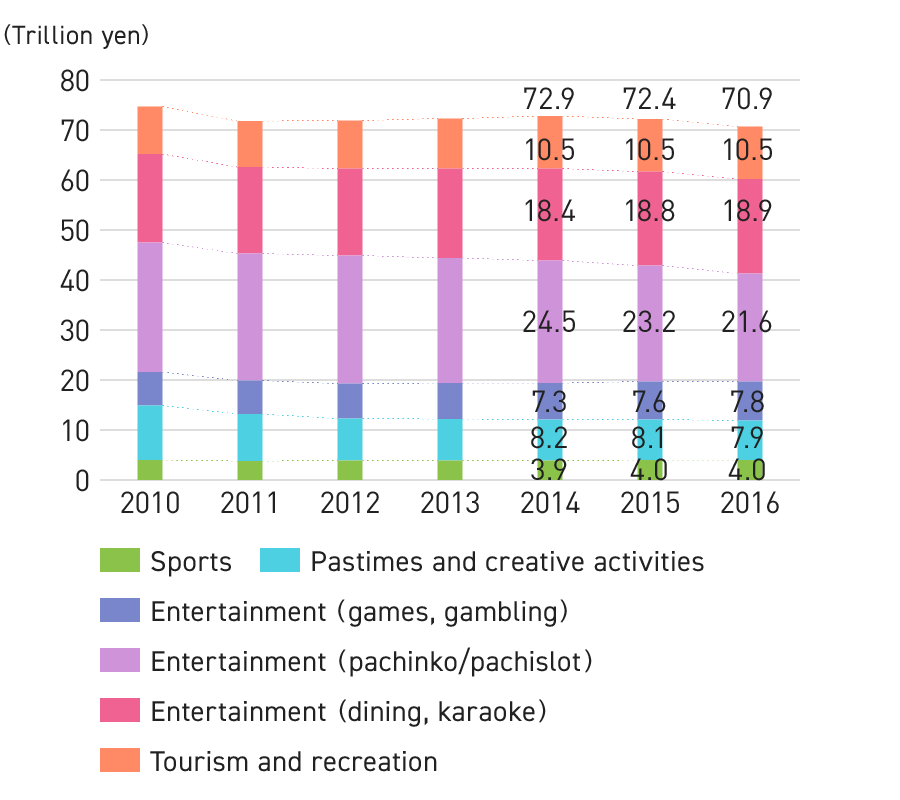
According to the Japan Productivity Center’s White Paper on Leisure 2017, the overall leisure market shrank 2.0% YoY, to ¥70,994.0 billion in 2016. Excluding the pachinko and pachislot market, which has an extremely large market scale, was excluded, the result was an increase of 0.3% YoY, indicating positive growth for the 4th consecutive year.
The sports market exhibited a 0.0% increase YoY, recording ¥4,028.0 billion, which indicated positive growth for the 5th consecutive year. This was due to the sporting goods market being in a recovering trend and the fitness club market achieving a record high result.
The pastimes and creative activities market shrank 1.6% YoY, to ¥7,986.0 billion. This was the 6th consecutive year that a decrease was observed. It was due to shrinkage in the concert, camera, video recorder/player, video software and book/magazine sales markets, etc. However, in the movie market, multiple hit Japanese movies resulted in a record high result, and in the distribution service market, fixed rate music distribution/paid movie distribution services grew rapidly.
Trends in Leisure Market
Source:
White Paper on Leisure 2017, Japan Productivity Center
The entertainment market shrank 2.6% YoY, to ¥48,424.0 billion. This was the 2nd consecutive year that a decrease was observed. It was due to decreases in the pachinko and pachislot, karaoke box and video game/game software markets. Meanwhile, markets for horse-racing, cycle-racing and speed boat-racing, all forms of government-operated gambling, remained bullish, and the online social game market continued to increase YoY.
The tourism and recreation market shrank 0.3% YoY, to ¥10,556.0 billion. This was because although the influence of an inbound tourism increase had resulted in continued strong results for the domestic tourism market in recent years, growth was not as strong as last year and the overseas travel market also shrank. However, the amusement park/theme park market achieved a record high for the 3rd consecutive year.
Trends in Content Market
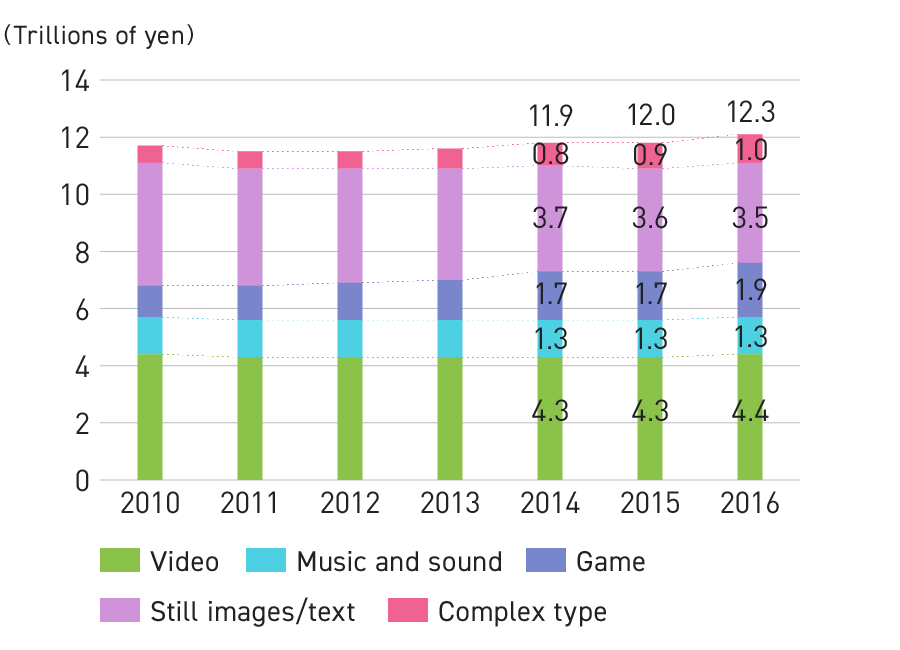
According to the White Paper on Digital Content 2017 by the Digital Content Association of Japan, content industry market such as Japanese movie, anime, TV program, game and book for 2016 increased by 2.7% YoY, to ¥12.3929 trillion.
In the video market, increases were seen for network distribution, movie and TV broadcast-related products, while packaged software and theater tickets exhibited decreases. This resulted in the overall market increasing by 2.0% YoY to ¥4,461.3 billion.
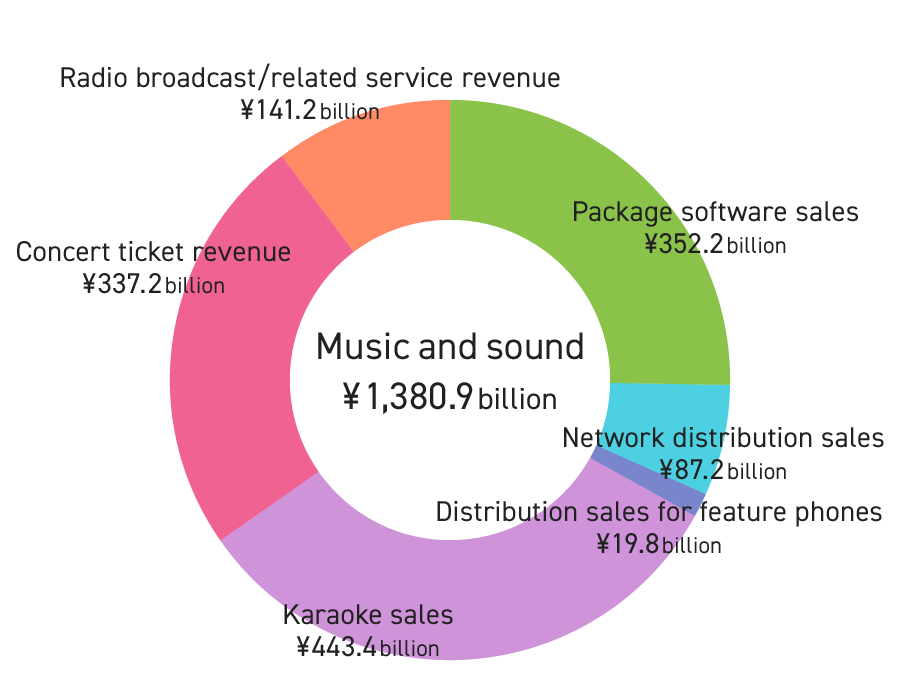
In terms of music and sound market, although network distribution continued to increase significantly from the previous year, results for concerts, karaoke and packaged software decreased, resulting in a mainly flat, result with a decrease of 0.5% YoY, at ¥1,380.9 billion.
Changes in Content Market
Source:
White Paper on Digital Content 2017, Digital Content Association of Japan.
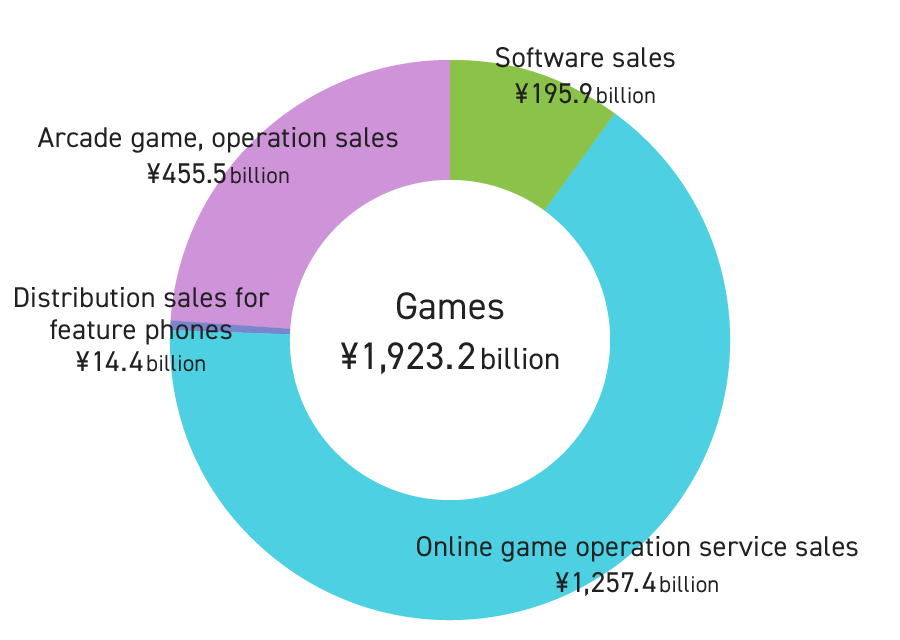
In the game market, a large increase continued to be seen for online games (PC/tablet and smartphone games excluding those for feature phones), whereas results for software and feature phones were in a decreasing trend. The overall result was an increase of 12.2% YoY, to ¥1,923.2 billion.
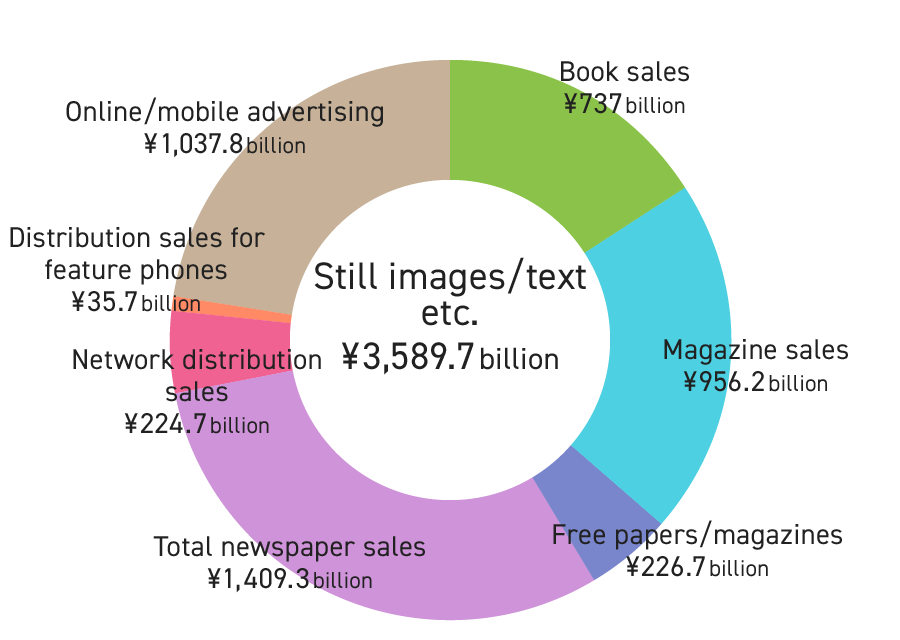
For still images/text, although e-books and e-magazines increased significantly large increases, book and magazine sales continued to exhibit negative growth for the 10th and 19th consecutive year, respectively. The overall result was a decrease of 2.1% YoY, to ¥3,589.7 billion.
*Still images/text: Books, magazines, newspapers, free papers/magazines, e-books, information distribution services
*Complex type: Online advertising, mobile advertising, etc.
Source:
White Paper on Digital Content 2017, Digital Content Association of Japan.
Trends in Publishing Market
According to the White Paper on Digital Content 2017 by the Digital Content Association of Japan, book sales in 2016 decreased by 0.6% YoY, to ¥737.0 billion. Thus, the decreasing trend continued. Magazine sales also fell below book sales, decreasing for the 19th consecutive year by 5.9% YoY, to ¥733.9 billion.
In recent years, the digitalization of the content market has progressed, with the digital ratio increasing by 1.9% YoY, reaching 67.9% in 2016. With this, large increases continued to be observed for e-books (increase of 24.7% YoY, to ¥197.6 billion) and e-magazines (increase of 24.7% YoY, to ¥30.2 billion).
Trends in Publishing Market
Trends in E-book/E-magazine Market
Source:
White Paper on Digital Content 2017, Digital Content Association of Japan.
Trends in Video Market
According to the White Paper on Digital Content 2017 by the Digital Content Association of Japan, the video market in 2016 increased by 2.0% YoY to ¥4,461.3 billion. This was due to increases in network distribution, movie and TV broadcast-related products. Package software continued to decrease.
Network distribution (excluding that for feature phones) increased greatly by 15.9% YoY to ¥161.9 billion, exceeding the DVD rental market for the first time. In the video network distribution field, due to the popularization of smartphones and tablets with the appearance of LTE (next-generation high speed mobile phone distribution standards) and 4G after 2010, new mobile phone carriers have entered the market and the conversion of contents to multiple devices has advanced. In addition, prices for contents have been lowered and fixed, and the range of contents has expanded as a result of efforts by the contents industry. Therefore, the market has expanded its field from core fans of video contents to include light fans.
In 2016, continuing on from last year, the entry of overseas SVOD (Subscription Video On Demand) distribution corporations into the Japanese market has led to increased choices for users of video content due to the appearance of live distribution services and free video services with advertising. Thus, the market has continued to expand.
Trends in Video Market
Source:
White Paper on Digital Content 2017, published by the Digital Content Association of Japan.
Global SVOD Market Forecast
Source:
Digital TV Research
Scale of Animation Industry Market
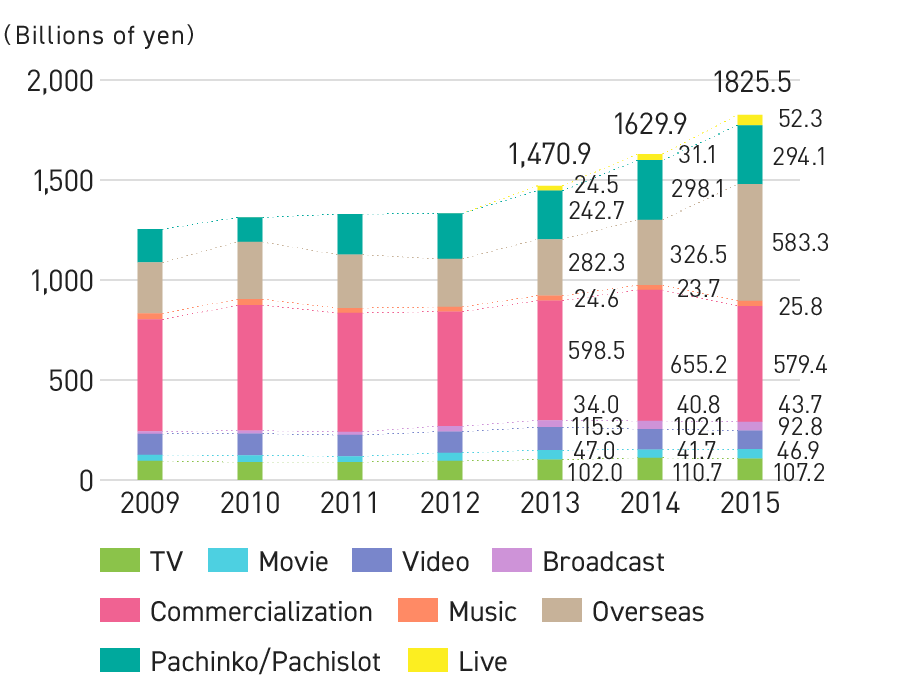
According to the Association of Japanese Animations (general incorporated association), the size of the animation industry market in 2015 was ¥1,825.5 billion (up 12.0% YoY), which was the 6th consecutive year of growth, setting a new record for the 3rd consecutive year. In recent years, the increase in revenue windows such as distribution, amusement and live entertainment has driven market expansion.
The breakdown shows a significant decline in video to ¥92.8 billion (down 9.1% YoY) and commercialization at ¥579.4 billion (down 11.6% YoY), a slight decrease in TV at ¥107.2 billion (down 3.2% YoY) and amusement at ¥294.1 billion (down 1.3% YoY), a significant increase for movies at ¥46.9 billion (up 12.5% YoY), music at ¥25.8 billion (up 8.9% YoY) and distribution at ¥43.7 billion (up 7.1% YoY), a steady increase live entertainment at ¥52.3 billion (up 68.4% YoY), and overseas business at ¥583.3 billion (up 78.7% YoY).
Changes in Scale of Animation Industry Market
Source:
Report on Japanese Animation Industry 2016, Association of Japanese Animation
Overseas Sales for Japanese Animation Industry Market
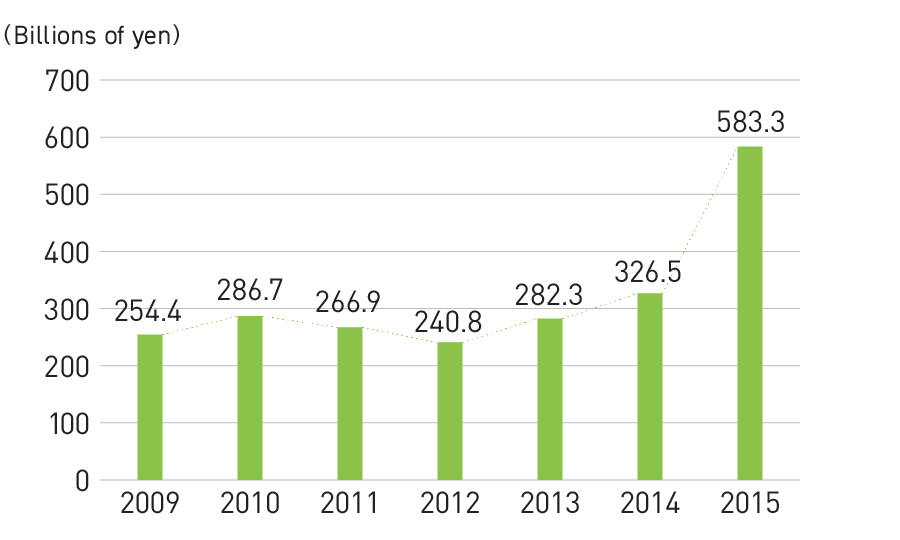
According to the Association of Japanese Animations, overseas sales for the Japanese animation industry market rose sharply in 2015 to ¥583.3 billion (up 78.7% YoY), as the year saw the animation industry actively begin to respond to overseas markets.
Over the previous three years, overseas sales were unchanged, however, this sudden record sales turnover is largely due to the explosive purchasing in China. The market expansion was also driven by exponential growth in the revenue window for distribution, mainly in China. Advances in the media environment in Thailand and Malaysia have also helped to lead this market expansion.
Changes in Overseas Sales for Japanese Animation Industry Market
Source:
Report on Japanese Animation Industry 2016, Association of Japanese Animation
Trends of Game Market in Japan
The Famitsu Game White Paper 2017 by Gzbrain Inc. states that the household game market decreased 4.5% YoY to ¥343.9 billion (total of game hardware and software) in 2016.
Meanwhile, the online platform game market (game apps for smartphones/tablets, games for feature phones, and online PC games) increased 3.7% YoY to ¥1,036.1 billion. As a result, the size of the game market in Japan reached a record-high of ¥1,380.0 billion, increased 1.5% YoY.
Within the online platform game market, the size of the game app market (game apps for smartphones/tablets for games on SNS platforms for feature phones) increased 4.4% YoY to ¥969.0 billion, accounting for approximately 70% of the domestic game market and helping to drive its expansion.
Changes in Scale of Game Market in Japan
Source:
White Paper on Famitsu Games 2017, Gzbrain Inc.
*Numerical values of less than ¥100 million have been rounded down.
Scale of Overseas Game Content Market
According to the Famitsu Game White Paper 2017 of Gzbrain Inc., the overseas game content market was ¥8,997.7 billion (up 8.8% YoY) in 2016.
The breakdown of this shows that the packaging market for PCs and console games was ¥1,153.1 billion, and digital sales market for mobile, PC, and console games grew by more than 10% to ¥7, 844.5 billion.
By region, the Asian market was ¥4,133.5 billion (up 19.1% YoY), U.S. was ¥2,532.8 billion (up 15.2% YoY), and Europe was ¥1,843.6 billion (up 1.6% YoY).
*Asia: total for Japan, China, and Korea
*Europe: total for countries in Western, Central, and Eastern Europe.
Aggregate total for the UK, Germany, France, Spain, Italy, Scandinavia, and Benelux region, for household packages only.
*In some areas, the countries and regions included in calculations may differ from 2015 to 2016.
Scale of Overseas Game Content Market
Source:
White Paper on Famitsu Games 2017, Gzbrain Inc.
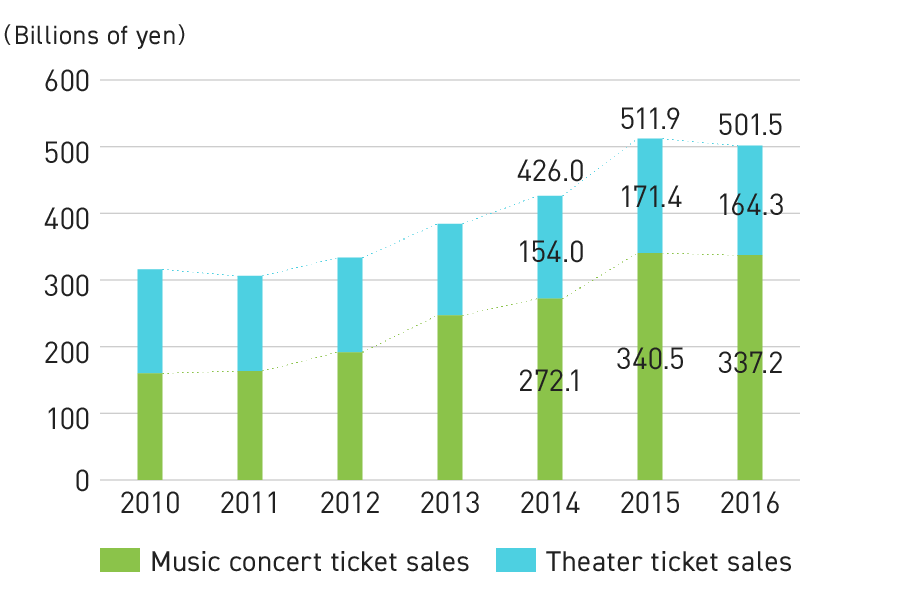
Trends in Live Entertainment Market
According to the White Paper on Digital Content 2017 by the Digital Content Association of Japan, the domestic live entertainment market in 2016 shrank by 2.0% YoY to ¥501.5 billion.
Specifically, decreases were noted for both theater ticket sales revenue (down 4.1% YoY, to ¥164.3 billion) and music concert ticket sales revenue (down 1.0% YoY, to ¥337.2 billion). This was the first decrease in 9 years for the music concert market.
*Domestic live entertainment market size: Total estimated ticket sales amounts for music concerts and theater performance events are given the narrow definition of live entertainment market size.
Changes in Live Entertainment Market
Source:
White Paper on Digital Content 2017, published by the Digital Content Association of Japan.
Trends in Character Business Market
According to Yano Research Institute, Ltd’s Licensed Character Business in Japan: Key Research Findings 2016, in fiscal 2015 the character business market amounted to ¥2,428.2 billion (up 0.6% YoY), up slightly but remaining mostly flat.
Toys, which account for a major share of the merchandise licensing market, struggled causing overall contraction. However, apparel and fashion accessories that promote the strengthening of products for adults performed well due to the success of efforts related to apparel worn by fashion models featuring characters from animation and other entertainment.
The copyrights market expanded significantly due to the enhanced rebranding of classic characters and the aggressive use of characters in sales promotions.
Trends in Character Business Market
Source:
Yano Research Institute, Ltd’s Licensed Character Business in Japan: Key Research Findings 2016
Merchandising rights: The right to use characters for ancillary products. Calculated on a retail sales amount basis.
Copyrights: The right to use character images in published materials and advertising. Calculated on a contract amount basis.
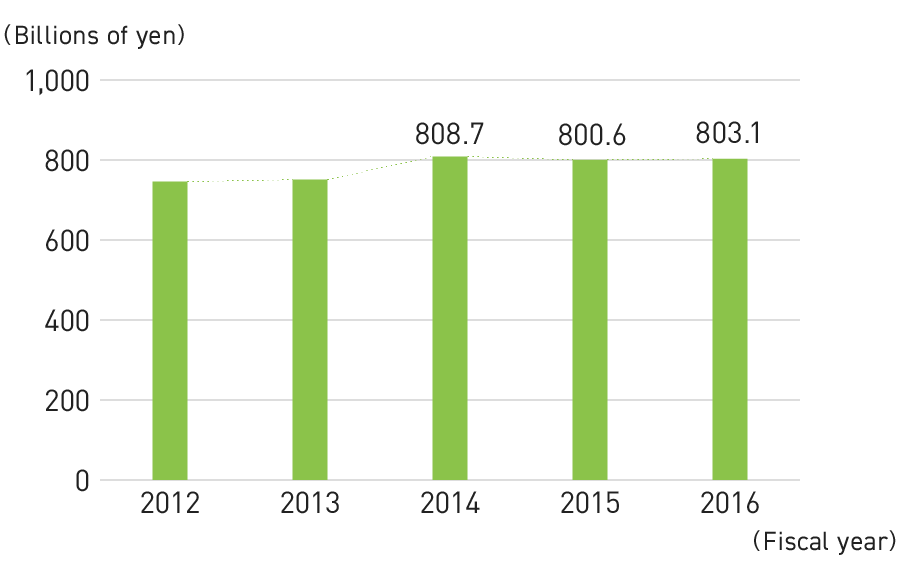
Trends in Toy Market
According to information published by the Japan Toy Association (general incorporated association), the Japanese toy market was ¥803.1 billion in FY2016 (up 0.3% YoY), exceeding ¥800 billion for the third consecutive year. In the announced peripheral fields, the market size for capsule toys fell by 10.9% YoY to ¥27.7 billion, and the market size for toy confectionery fell by 10.0% YoY to ¥46.8 billion.
In FY2016, following on from the previous year, trading card games remained popular, and sales increased for classic items such as doll houses and dolls. One factor was an increase in the number of boys playing “house” with toys that are usually considered girls toys. In addition, sales declined for high-tech trend toys (interactive toys, robots, cameras, personal computers, apps, etc.), due to the reaction towards hit items of the previous year.
Changes in Scale of Toy Market
Source:
Data released by the Japan Toy Association
Trends in Pachinko/Pachislot Market
Trends in Playing Population
According to the Japan Productivity Center’s White Paper on Leisure 2017, the number of people (estimated) that played pachinko and pachislot in 2016 shrank by 1.3 million people from the previous year to 9.4 million people, falling below 10 million people for the first time since 2013.
Trends in Playing Population/Changes in Number of Pachinko Halls
Source:
White Paper on Leisure 2017, Japan Productivity Center; 2016 White Paper on Adult Entertainment Businesses, National Police Agency.
Trends in Number of Pachinko Halls and, Pachinko and Pachislot Machines Installations
Statistical data released by the National Police Agency (NPA) indicates that the number of pachinko halls in Japan decreased by 324 YoY, to 10,986 in 2016. Although the number of installed machines decreased by approximately 50,000 YoY to 4.52 million machines, the number of machines installed per hall increased by 6.9 machines to 411.9 machines, indicating continuation of the trend for larger halls.
Changes in Number of Pachinko and Pachislot Machine Installations
Source:
2016 White Paper on Adult Entertainment Businesses, National Police Agency.
Trends in Pachinko and Pachislot Machine Sales
According to Yano Research Institute, Ltd’s Pachinko Maker Trends 2017, pachinko machine sales were down 16.9% YoY, to 1.56 million units in 2016. Pachislot machine sales down 8.4% YoY, to 880,000 units. As a result, the total sales market for pachinko and pachislot machines down 10.2% YoY, to ¥882.1 billion, with the pachinko market down 14.4% YoY, to ¥524.5 billion, and the pachislot market down 3.3%YoY, to ¥357.6 billion.
In September 2014, changes made to the model certification test method of pachislot machines triggered a series of voluntary regulations by industry bodies, which resulted in revisions of the development and sales schedules for various manufacturers. This has been a significant variation factor.
Changes in Pachinko and Pachislot Machine Sales
Source:
Pachinko Maker Trends 2017, Yano Research Institute, Ltd
Explanation of Recent Pachinko and Pachislot Market Regulations and Other Developments
In August 2014, the National Police Agency (NPA) informed industry bodies of partial changes in the model certification test method for pachislot machines. Along with this, several announcements were made by industry bodies pertaining to pachislot machine specifications requiring design reviews in multiple areas. About this time, in March 2015, industrial bodies announced “initiatives to restrict gambling” affecting pachinko machines.
Consequently, with a sales deadline for old standard pachinko and pachislot machines, the market became confused, seeing a sharp decline in test conformance, convergence of sales due to the sales deadline, and a sharp drop in sales immediately following the deadline.
On July 11, 2017 the National Police Agency announced the “Draft Regulation Partially Amending the Ordinance for Enforcement of the Act on Control and Improvement of Amusement Business, etc. and the Regulations for the Verification of Licenses, Formats and Other Aspects of Pachinko and Pachislot Machines,” including pachinko payout regulations. This is expected to come into force on February 1, 2018.
Given these circumstances and future market forecasts, FIELDS intends to build a business foundation that will not be affected by changes in the market environment. Consequently, we are working on various measures such as reinforcing our distribution base, which is our strength, boosting relationships with partner manufacturers, and expanding our handled products. In addition, the FIELDS CORPORATION GROUP is planning to temporarily reduce the speed of investment in private brands.
Pachislot Regulatory Trends
Pachinko Regulatory Trends
Structure of related laws and regulations
Company and product names and service names in this document are the trademarks or registered trademarks of their respective companies.