Results of Operations and Financial Position for the Fiscal Year Ended March 31, 2015
Review of Business Performance in the Fiscal Year Ended March 31, 2015
In the fiscal year ended March 31, 2015, although the number of pachinko machines sold increased, the number of pachislot machines sold decreased, due primarily to fluctuating business performance throughout the year.
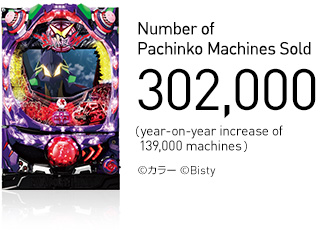
In regard to pachinko machines, the number of machines sold increased 139,000 year-on-year, to 302,000, with sales of each type exceeding expectations, starting with CR EVANGELION 9. This was the result of promoting a wide variety of sales initiatives geared toward expanding sales of pachinko machines featuring prominent IP.
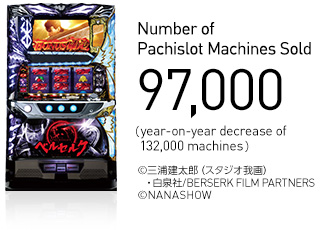
As for pachislot machines, the number of machines sold decreased 132,000 year-on-year, to 97,000, despite sales of the three titles launched during the year under review being better than planned, starting with Pachislot BERSERK. This decrease was the result of changes made to the pachislot model certification test method in September 2014, which delayed the launch of five different titles until next fiscal year.
Consolidated Performance Highlights
Millions of Yen
| Year Ended March 31, 2013 |
Year Ended March 31, 2014 |
Year Ended March 31, 2015 |
Year Ending March 31, 2016 (Forecast) |
|
|---|---|---|---|---|
| Net sales | 108,141 | 114,904 | 99,554 | 120,000 |
| Year-on-year (%) | 117.3 | 106.3 | 86.6 | 120.5 |
| Ratio to net sales (%) | 100.0 | 100.0 | 100.0 | 100.0 |
| Gross profit | 33,279 | 33,812 | 28,468 | — |
| Year-on-year (%) | 106.2 | 101.6 | 84.2 | — |
| Ratio to net sales (%) | 30.8 | 29.4 | 28.6 | — |
| Selling, general and administrative expenses |
22,964 | 24,020 | 23,724 | — |
| Year-on-year (%) | 100.7 | 104.6 | 98.8 | — |
| Ratio to net sales (%) | 21.2 | 20.9 | 23.8 | — |
| Operating income | 10,314 | 9,791 | 4,743 | 6,000 |
| Year-on-year (%) | 121.0 | 94.9 | 48.4 | 126.5 |
| Ratio to net sales (%) | 9.5 | 8.5 | 4.8 | 5.0 |
| Ordinary income | 10,268 | 9,765 | 5,491 | 6,500 |
| Year-on-year (%) *1 | 118.6 | 95.1 | 56.2 | 118.4 |
| Ratio to net sales (%) | 9.5 | 8.5 | 5.5 | 5.4 |
| Net income | 4,720 | 5,370 | 3,018 | 3,500 |
| Year-on-year (%) | 78.8 | 113.7 | 56.2 | 115.9 |
| Ratio to net sales (%) | 4.4 | 4.7 | 3.0 | 2.9 |
| Shareholders’ equity ratio (%) | 51.2 | 55.6 | 53.9 | — |
| Return on equity (ROE) (%) | 8.9 | 9.5 | 5.1 | — |
| Return on assets (ROA) (%) | 10.3 | 9.2 | 5.1 | — |
| Dividends per share (Yen) *2 | 50 | 50 | 60 | 50 |
| Payout ratio (%) | 35.1 | 30.9 | 66.0 | 47.4 |
*1 Ordinary income is used as one of the important performance indicators in Japanese GAAP. This classification consists of the addition of the balance of financial income, such as interest income (expense), foreign exchange gain (loss), etc., to operating income.
*2 The dividend payment of ¥60 per share for the fiscal year ended March 31, 2015, includes a commemorative dividend of ¥10 per share.
Total Assets, Liabilities, and Net Assets
The change in total current assets was largely attributable to notes and accounts receivable–trade rising ¥16,732 million year-on-year, to ¥45,888 million.
The change in total current liabilities was mainly due to a ¥3,380 million increase in short-term bank loans, to ¥4,014 million.
The change in total net assets was primarily a result of retained earnings rising ¥1,501 million, to ¥46,049 million, due to an increase in net income.
Consolidated Financial Highlights
Millions of Yen
| At March 31, 2013 | At March 31, 2014 | At March 31, 2015 | Change | |
|---|---|---|---|---|
| Total current assets | ¥72,709 | ¥66,921 | ¥71,014 | 4,093 |
| Property and equipment, net | 11,151 | 12,104 | 12,197 | 92 |
| Total intangible fixed assets | 4,540 | 4,365 | 4,490 | 124 |
| Total investments and other assets | 18,226 | 21,477 | 22,614 | 1,137 |
| Total fixed assets | 33,918 | 37,948 | 39,302 | 1,354 |
| Total assets | 106,628 | 104,869 | 110,316 | 5,447 |
| Total current liabilities | 47,365 | 41,730 | 45,773 | 4,043 |
| Total long-term liabilities | 4,164 | 4,386 | 4,296 | (89) |
| Total liabilities | 51,529 | 46,116 | 50,070 | 3,954 |
| Total shareholders’equity | 54,957 | 58,670 | 60,171 | 1,501 |
| Total accumulated other comprehensive loss | (398) | (390) | (679) | (289) |
| Minority interests | 539 | 473 | 753 | 280 |
| Total net assets | 55,098 | 58,753 | 60,246 | 1,493 |
| Total liabilities and net assets | 106,628 | 104,869 | 110,316 | 5,447 |
Cash Flows
Net cash used in operating activities amounted to ¥9,086 million, compared with ¥16,322 million provided by operating activities in the previous fiscal year. This was mainly attributable to an increase in notes and accounts receivable–trade. As a result, free cash flow decreased ¥23,687 million, to negative ¥15,384 million.
Consolidated Cash Flows
Millions of Yen
| At March 31, 2013 | At March 31, 2014 | At March 31, 2015 | Change | |
|---|---|---|---|---|
| Net cash provided by (used in) operating activities |
13,570 | 16,322 | (9,086) | (25,408) |
| Net cash used in investing activities | (6,263) | (8,018) | (6,297) | 1,720 |
| Net cash used in financing activities | (2,277) | (2,018) | 1,624 | 3,643 |


