*1 From FY03/16, business contract fee calculation categorization changed.
FY03/11
FY03/12
FY03/13
FY03/14
FY03/15
FY03/16
Financial Position (Millions of yen):
YoY change
YoY change
YoY change
YoY change
YoY change
YoY change
Total assets
78,971
(2,357)
93,601
14,630
106,628
13,026
104,869
(1,758)
110,316
5,447
92,478
(17,838)
Total net assets
47,021
5,834
51,555
4,533
55,098
3,543
58,753
3,654
60,246
1,493
58,291
(1,954)
Shareholders’ equity
46,779
5,714
51,071
4,291
54,559
3,487
58,279
3,720
59,492
1,212
57,304
(2,188)
Interest-bearing liabilities
1,834
(395)
1,660
(172)
1,052
(609)
743
(308)
4,065
3,321
11,423
7,357
Cash Flows (Millions of yen):
YoY change
YoY change
YoY change
YoY change
YoY change
YoY change
Cash flows from operating activities
8,005
(424)
10,015
2,010
13,570
3,554
16,322
2,752
(9,086)
(25,408)
13,353
22,439
Cash flows from investing activities
(4,356)
(3,344)
(4,798)
(441)
(6,263)
(1,465)
(8,018)
(1,754)
(6,297)
1,720
(2,191)
4,106
Cash flows from financing activities
(3,915)
(1,227)
(2,565)
1,349
(2,277)
288
(2,018)
258
1,624
3,643
5,214
3,590
Free cash flow
3,649
(3,769)
5,217
1,568
7,307
2,088
8,303
997
(15,384)
(23,687)
11,162
26,546
Per share data (JPY)*2
Net income
226.44
180.45
142.27
161.83
90.97
3.58
Total net assets
1,408.53
1,539.04
1,644.15
1,756.27
1,792.83
1,726.88
Dividends per share
50
50
50
50
60
50
Key Financial Indicators (%):
Return on equity (ROE)
17.1
12.2
8.9
9.5
5.1
0.2
Return on assets (ROA)
17.1
10.0
10.3
9.2
5.1
1.4
Shareholders’ equity ratio
59.2
54.6
51.2
55.6
53.9
62.0
*2 October 1, 2012, a stock split at a ratio of 100 shares for each common share was executed, thus the retroactive calculation takes into account this stock split retroactively.
From here, key financial indicators (consolidated) can be viewed in the chart generator.
Business performance in FY03/16 is as follows. As in the previous fiscal year, performance was affected by regulations and other developments in the pachinko/pachislot industry, which represents the largest market for our IP rollout in terms of media.
Results of Operations (Millions of yen):
FY03/15
FY03/16
FY03/17
Full-year performance
YoY change
Full-year performance
YoY change
Full-year forecast
YoY change
Net sales
99,554
86.6%
94,476
94.9%
115,000
121.7%
Gross profit
28,468
84.2%
25,480
89.5%
As a percent of sales
28.6%
27.0%
Operating income
4,743
48.4%
1,411
29.6%
2,000
141.7%
As a percent of sales
4.8%
1.5%
Ordinary income
5,491
56.2%
1,380
25.1%
2,000
144.9%
As a percent of sales
5.5%
1.5%
Net income attributable to owners of parent
3,018
56.2%
118
3.9%
1,000
842.7%
As a percent of sales
3.0%
0.1%
Explanation of Recent Pachinko/Pachislot Market Regulations and Other Developments
In August 2014, the National Police Agency (NPA) informed industry bodies of partial changes in the model certification test method for pachislot machines. These changes were implemented about two weeks after this announcement.
Along with this, several announcements were made by industry bodies pertaining to pachislot machine specifications requiring design reviews in multiple areas as well as the date by which these changes had to be implemented and sales timeframes.
About this time, in March 2015, industrial bodies announced “initiatives to restrict gambling” affecting pachinko machines. Multiple requirements were established, including the date by which these measures had to be implemented and sales timeframes.
As a result, the market fell into disarray due to a significant drop in the number of machines conforming to tests and plunging sales caused by sales concentration and during and after the sales timeframe.
Faced with these conditions, Fields collaborated with each of our affiliated manufacturers as a distribution trading company handling multiple brands to pursue responses and countermeasures including the review and development of new specifications and streamlined sales lineups.
As a result, 5 pachislot machines in the previous fiscal year and 2 pachinko/pachislot machines in the fiscal year under review were postponed until next fiscal year.
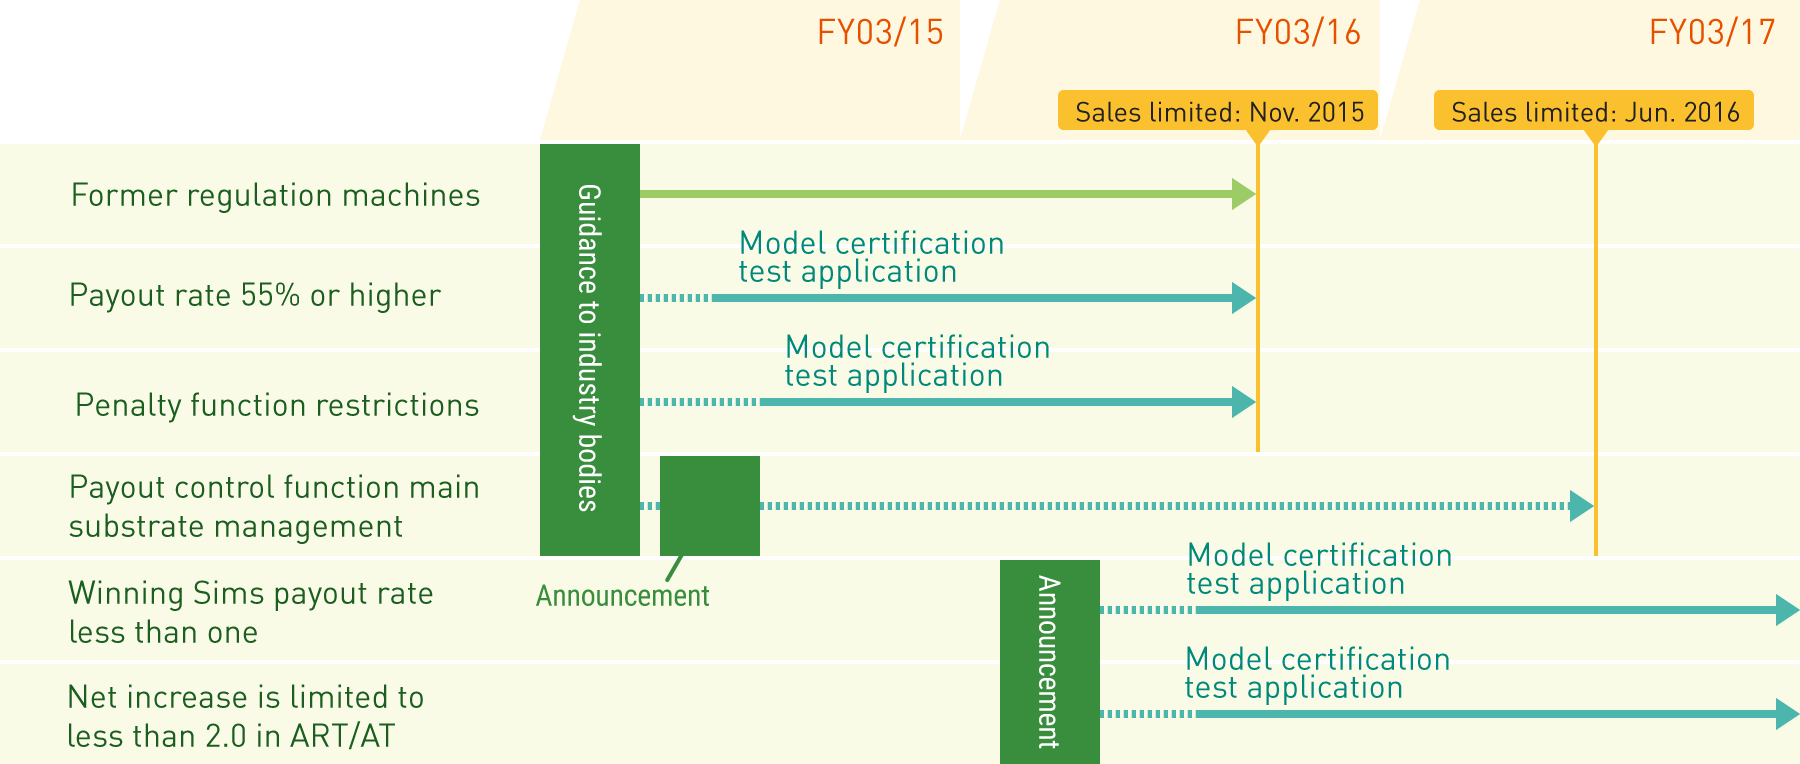
Pachislot Regulatory Trends
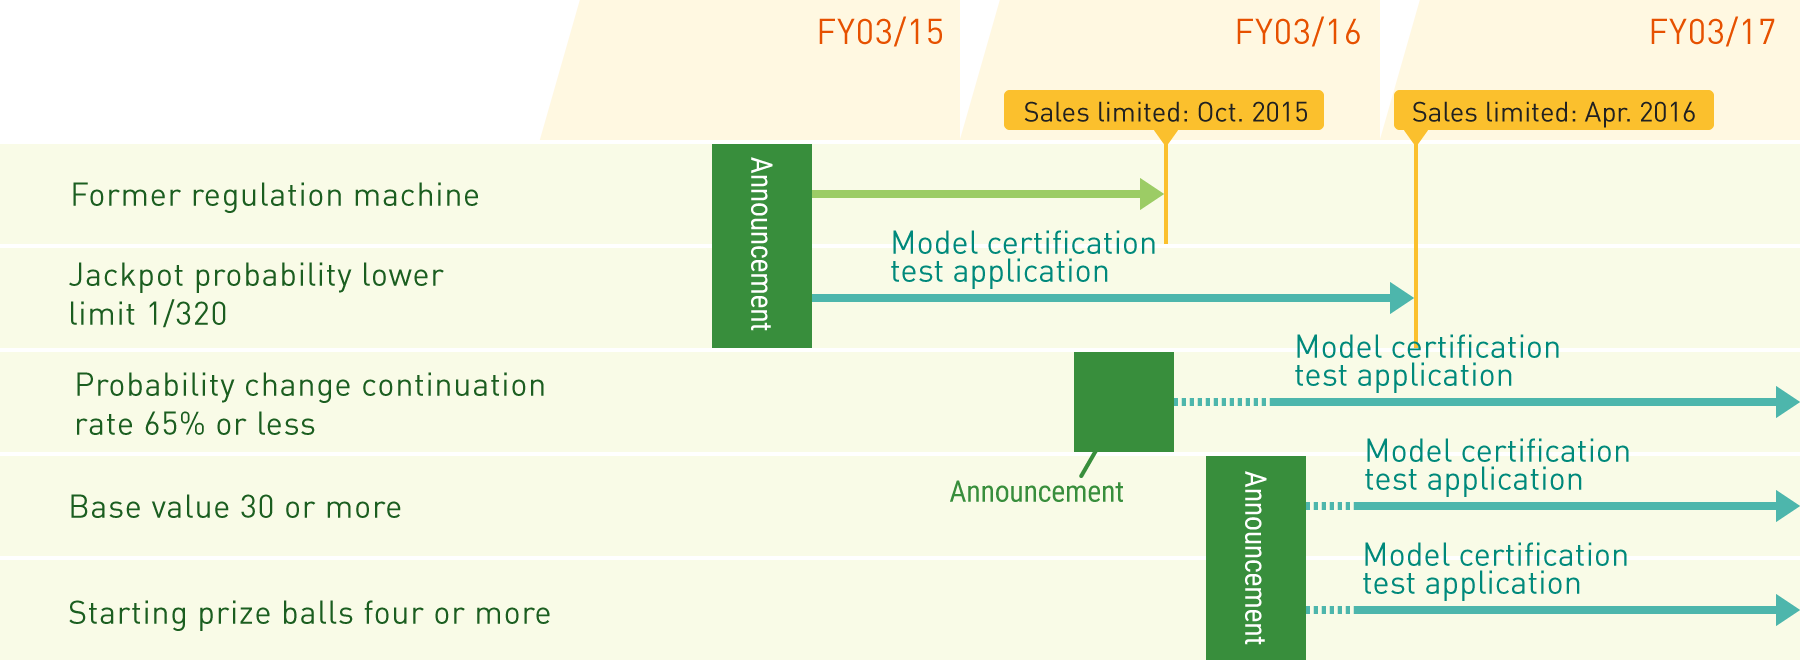
Pachinko Regulatory Trends
Total Assets, Liabilities and Net Assets
Total assets decreased ¥17,838 million from the end of the previous fiscal year, to ¥92,478 million. This was due mainly to a decline in notes and accounts receivable–trade related to pachinko/pachislot machines sales, resulting in an ¥18,079 million decrease in total current assets from the end of the previous fiscal year.
Total liabilities declined ¥15,884 million from the end of the previous fiscal year, to ¥34,186 million. This was due mainly to a decrease in accounts payable–trade related to pachinko/pachislot machines sales, resulting in a ¥15,963 million decline in total current liabilities from the end of the previous fiscal year.
Total net assets shrank ¥1,954 million from the end of the previous fiscal year, to ¥58,291 million. This was due mainly to a ¥1,872 million decrease in retained earnings from the end of the previous fiscal year.
(Millions of yen)
At March 31, 2015
At March 31, 2016
Increase (decrease)
Total current assets
71,014
52,934
(18,079)
Tangible assets
12,197
11,447
(749)
Intangible assets
4,490
3,746
(743)
Investments, other assets
22,614
24,348
1,734
Total assets
110,316
92,478
(17,838)
At March 31, 2015
At March 31, 2016
Increase (decrease)
Total current liabilities
45,773
29,809
(15,963)
Total fixed liabilities
4,296
4,376
79
Net assets
60,246
58,291
(1,954)
Total liabilities and net assets
110,316
92,478
(17,838)
Cash Flows
Net cash provided in operating activities amounted to ¥13,353 million, compared with ¥9,086 million provided by operating activities in the previous fiscal year. This was mainly attributable to a ¥36,663 million decrease in notes and accounts receivable–trade and a ¥22,828 decrease in accounts payable–trade, both related to pachinko/pachislot machines sales, as well as ¥3,382 million in income taxes paid.
Net cash used in investing activities amounted to ¥2,191 million, compared with ¥6,297 million provided by investing activities in the previous fiscal year. This was mainly attributable to a ¥7,121 million increase in payment of loans receivable, ¥3,110 million and proceeds from redemption of other affiliated companies’ investment securities and ¥2,502 million from collection of loans receivable.
Net cash provided in financing activities amounted to ¥5,214 million, compared with ¥1,624 million provided by financing activities in the previous fiscal year. This was mainly attributable to ¥7,400 million increase in short-term loans payable and ¥1,990 million in cash dividends paid.
As a result, free cash flows amounted to ¥11,162 million.
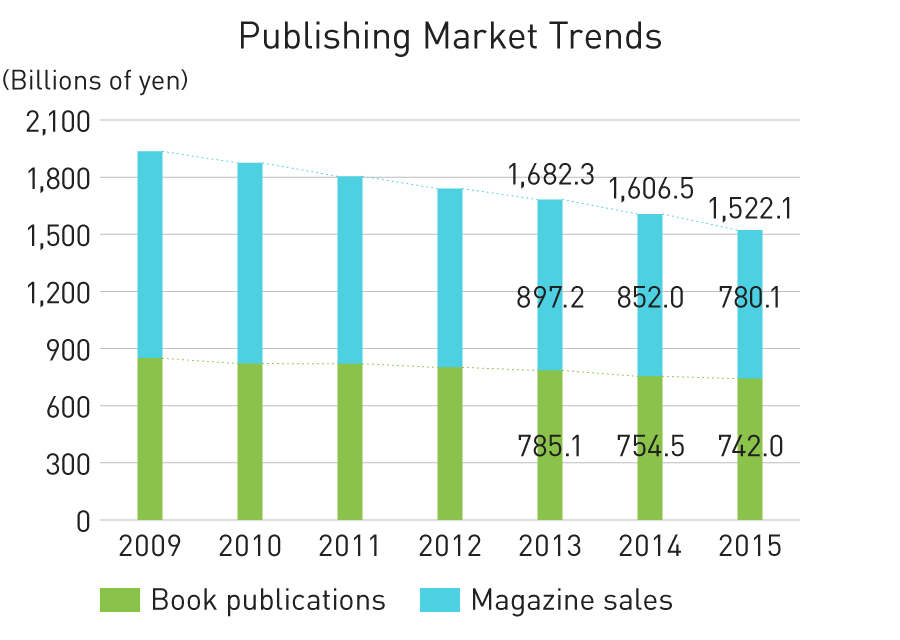
In the comic field, which is the origin of IP creation, the paper media market comprising books and magazines continued to shrink as the market for e-books using smartphones, tablets and other devices grew steadily.
According to the White Paper on Digital Content 2016 published by the Digital Content Association of Japan, book sales in Japan amounted to ¥742.0 billion (down 1.7% YoY) and although this is a modest decline, it is the ninth consecutive year of negative growth. Hibana was the only book to become a million-seller.
Magazine sales amounted to ¥780.1 billion (down 8.4% YoY), the 18th consecutive year of declines representing the lowest sales ever. The magazine market decreased by approximately ¥72.0 billion in one year.
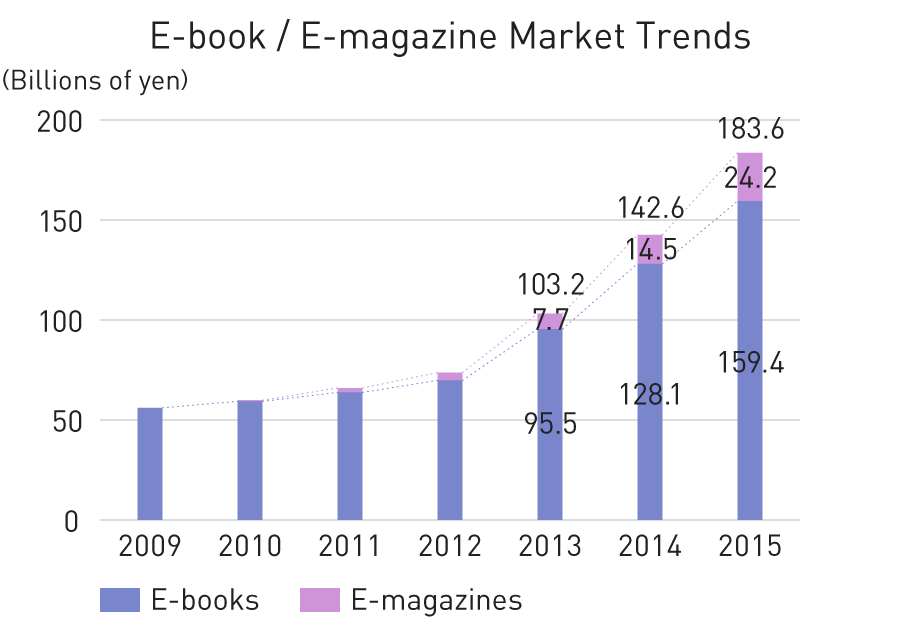
E-book sales expanded to ¥159.4 billion (up 24.4% YoY). Although sales for feature phones and PCs declined, sales for new platforms were substantially higher, easily covering the gap. E-magazine sales grew significantly to ¥24.2 billion (up 66.9% YoY).
Source:
White Paper on Digital Content 2016, Digital Content Association of Japan.
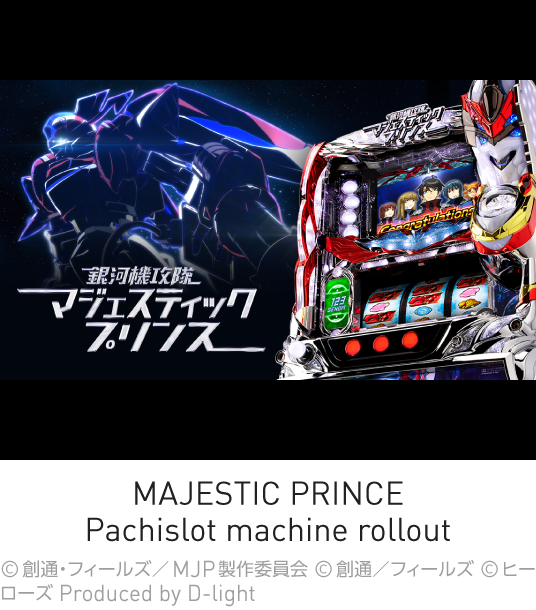
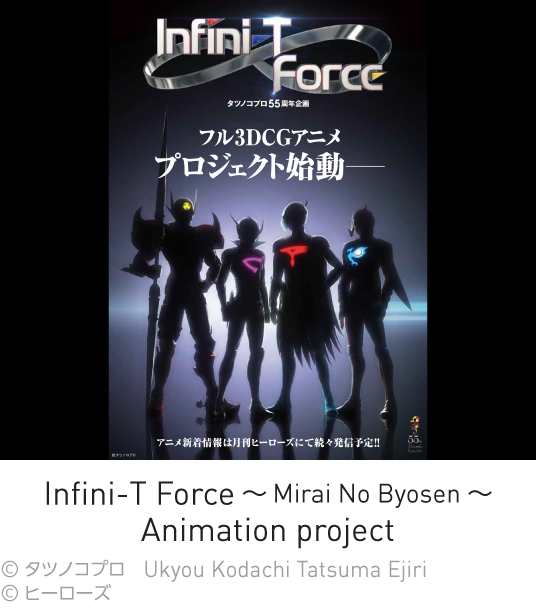
In FY03/16, we launched four new series to promote the ongoing creation of hero’s IP through HERO’S Monthly comic magazine. At the same time, we promoted animation projects for IP created for this magazine while promoting cross-media development for games, pachinko/pachislot and other media. In addition, we also began distribution of digital comics in China as one part of our global development efforts.
At present, we are continuing to focus efforts on the creation of hero’s IP, having created a total of 62 works as of the end of June 2016. Also, within digital comic distribution platforms, we are focused on expanding platforms in Japan as well as China to accelerate overseas rollouts.
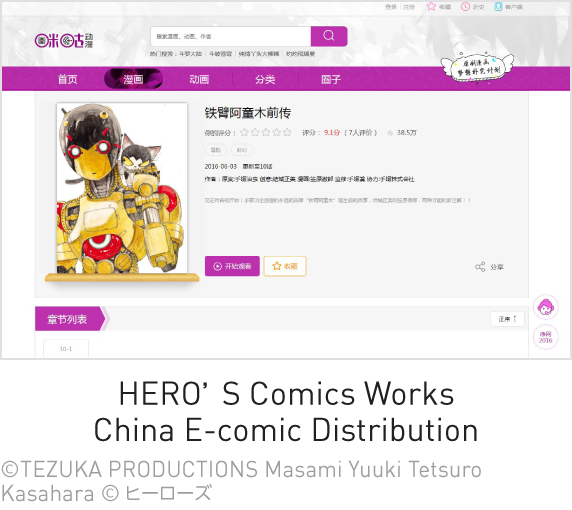
Launch of Distribution for Chinese E-book Platform
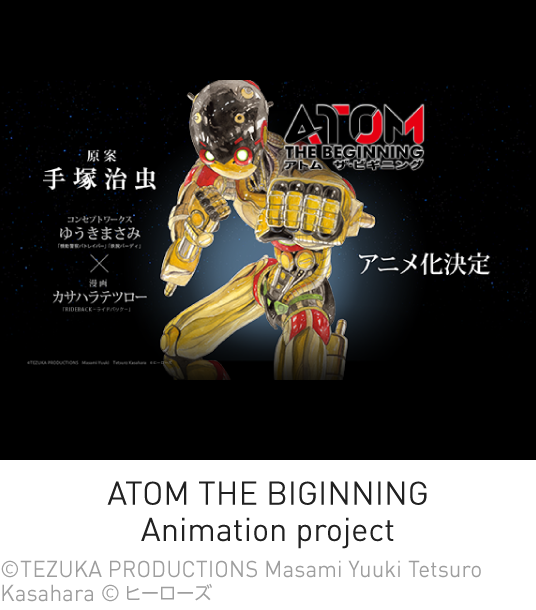
In March 2016, we began distributing a total of 13 titles, including works from HERO’S Monthly such as HERO COMPANY by Kazuhiko Shimamoto and ATOM THE BEGINNING, depicting the story of the birth of Astro Boy, on Migu Comic a platform managed by the China Mobile Group. We are moving steadily forward with global rollouts, including the launch of distribution on DAJIAOCHONG COMIC operated by Kidstone in July 2016.
Visual
In the IP added value and recognition enhancing visual field, the sale of DVDs, BDs and other video formats continues to shrink. However, subscription video on demand (SVOD) and other new platforms have arisen and are expected to dramatically expand markets both in Japan and overseas.
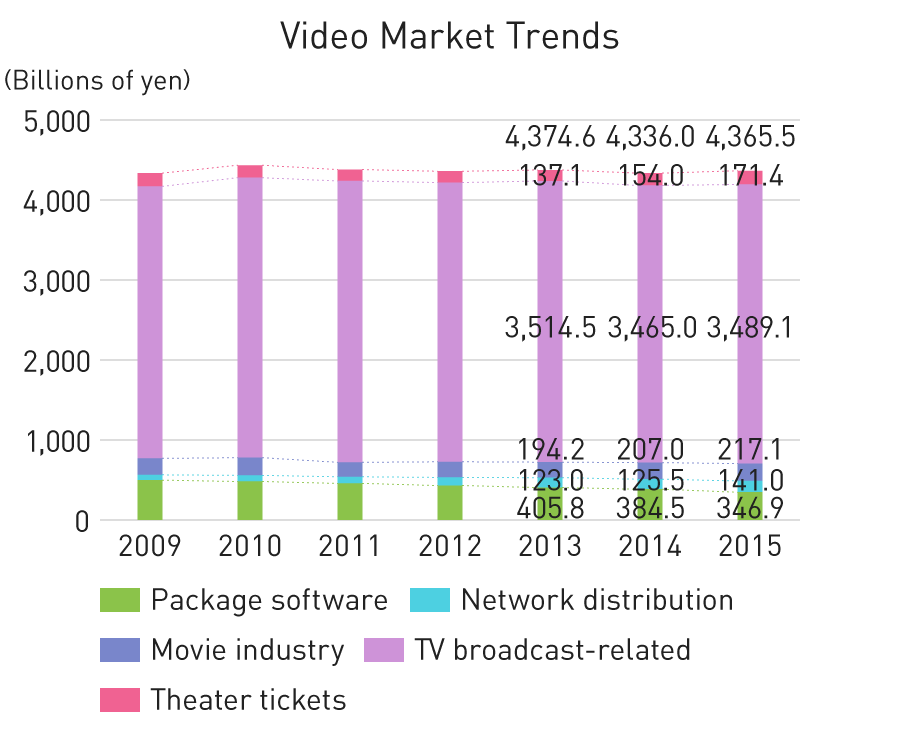
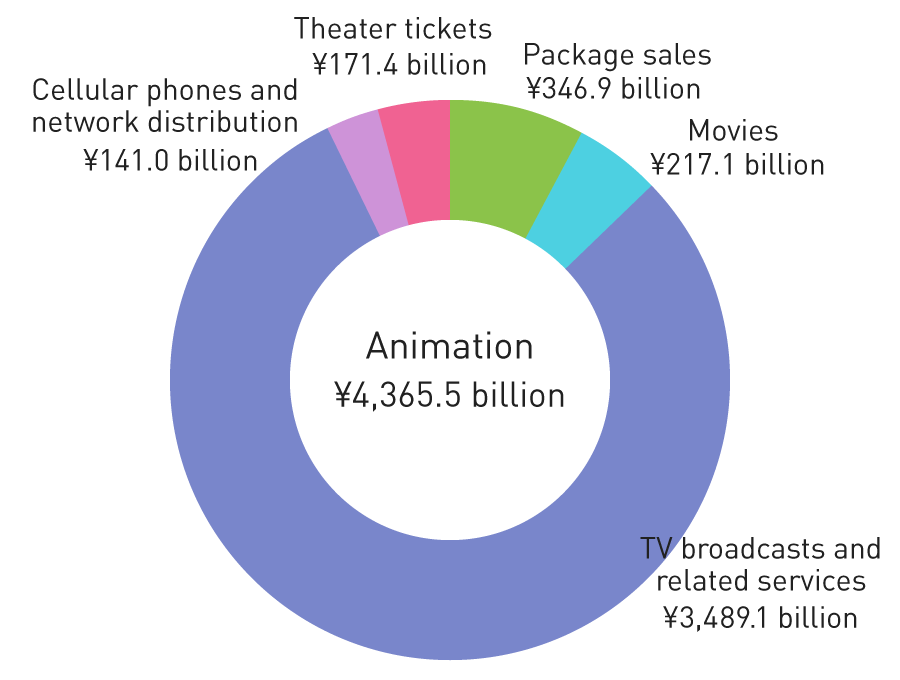
According to the White Paper on Digital Content 2016 published by the Digital Content Association of Japan, video sales amounted to ¥4,365.5 billion (up 0.7% YoY). Specifically, network distribution, movies, TV broadcasts and theatrical productions increased, while package sales continued to decline.
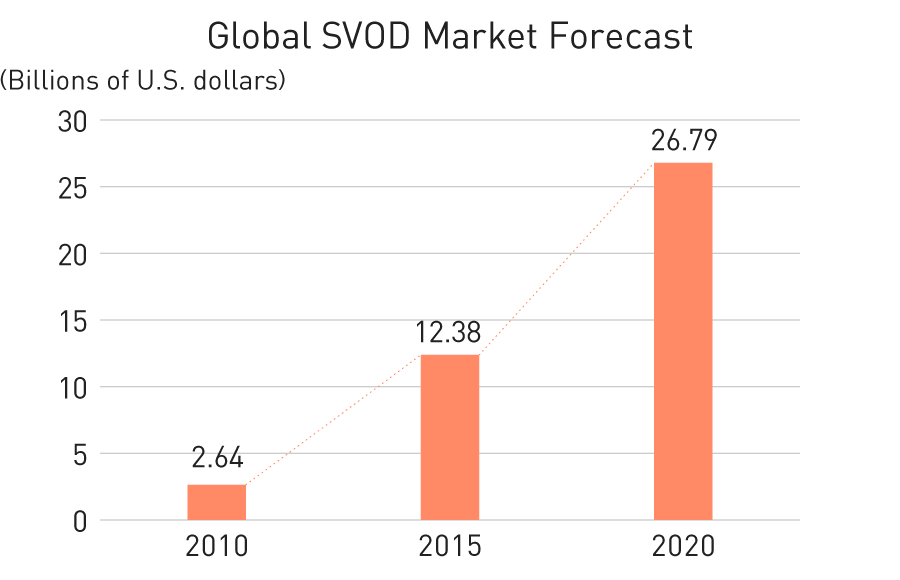
Network distribution (including feature phones) grew substantially to ¥141.0 billion (up 12.4% YoY). Since 2010, new entrants including overseas providers and mobile carriers as well as platform operator strategies have expanded the playing field for core fans of video content in the market through low-cost, fixed-price, multi-device plans and expanded content. Furthermore, the advance of SVOD, already established overseas, into the Japanese market has provided an opportunity to heighten recognition of video distribution as new players enter the market and invigorate business alliances.
Source:
White Paper on Digital Content 2016, published by the Digital Content Association of Japan.
Source:
Digital TV Research
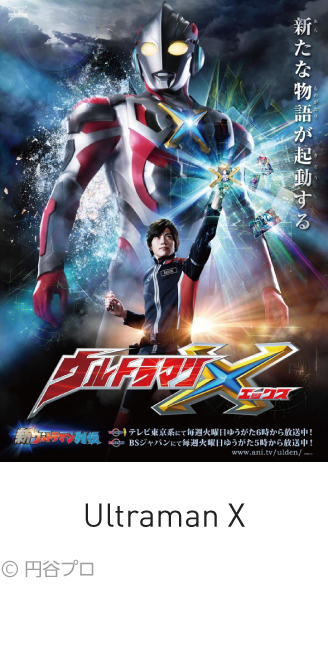
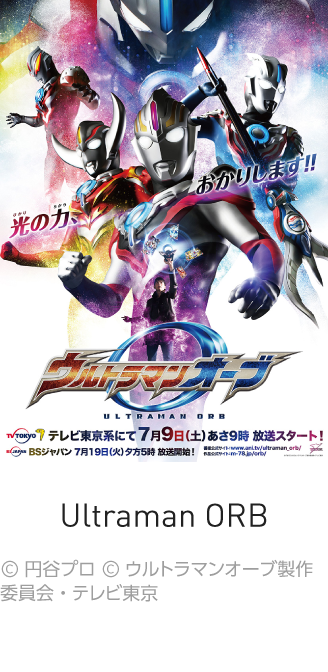
In FY03/16, Ultraman X, the latest title in the Ultraman series was broadcast. Also, ahead of the broadcast launch of new title Ultraman ORB, we promoted various initiatives including changing to timeslots providing a greater opportunities to connect with children. In terms of animation, we rolled out four works through TV and web distribution.
At present, we are focusing efforts on enhancing IP value through cross-media developments, including the promotion of merchandising and increasing recognition through visual development. In particular, we are promoting various measures from a global perspective, including Ultraman series visual development in cooperation with SVOD providers.
In the game field, one of our IP earnings platforms, although the market for household video games is shrinking, online platforms such as the social game market are solid, driven by growing numbers of market participants.
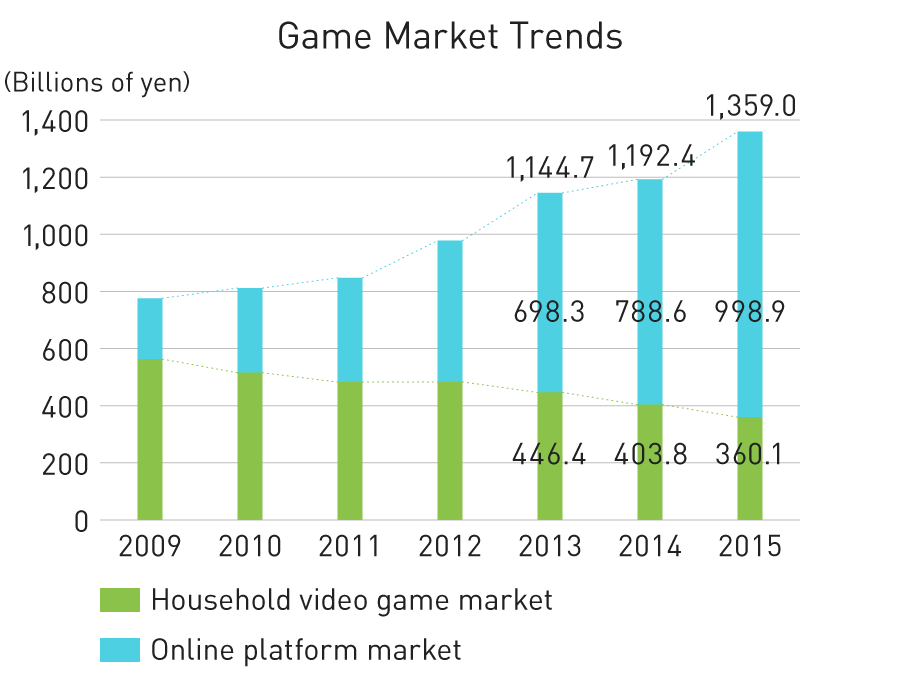
According to the KADOKAWA DWANGO CORPORATION’s Famitsu Game White Paper 2016, the household game market decreased 10.8% year-on-year, to ¥360.1 billion (total of game hardware and software) in 2015. Meanwhile, the online platform game market (game apps for smartphones/tablets, games on SNS platforms for feature phones, and online PC games) jumped 26.7%, to ¥998.9 billion. As a result, the size of the game market in Japan reached a record-high ¥1,359.0 billion, up 14.0% year-on-year.
Source:
KADOKAWA DWANGO CORPORATION’s Famitsu Game White Paper 2016
In FY03/16, we launched services for three titles including the TOWER of PRINCESS to promote planning and development of original proposals aimed at creating new IP and new titles using leading IP. Also, with respect to existing titles, we engaged in aggressive advertising to raise awareness and conducted reforms aimed at improving service quality.
Currently, we are making an effort to build new partnerships, including licensing arrangements with overseas providers, as well as conducting aggressive advertising aimed at expanding the fan base for titles with improved game characteristics and monetization.
In the live entertainment field, which is responsible for expanding awareness of IP and cultivating loyalty, the market is expanding due to the solid performance of music concerts and theatrical performances (stage productions, musicals, Kabuki, Noh and Kyogen, etc.).
According to the White Paper on Digital Content 2016 published by the Digital Content Association of Japan, the live entertainment market exhibited a high growth rate, expanding to ¥511.9 billion (up 20.1% YoY) in 2015.
Specifically, there was noteworthy growth in theater ticket sales which amounted to ¥171.4 billion (up 11.3% YoY) and, concert ticket sales, which amounted to ¥340.5 billion (up 25.2% YoY). Concert ticket sales scale and growth was particularly strong, increasing for the eighth consecutive year.
Source:
White Paper on Digital Content 2016, published by the Digital Content Association of Japan.
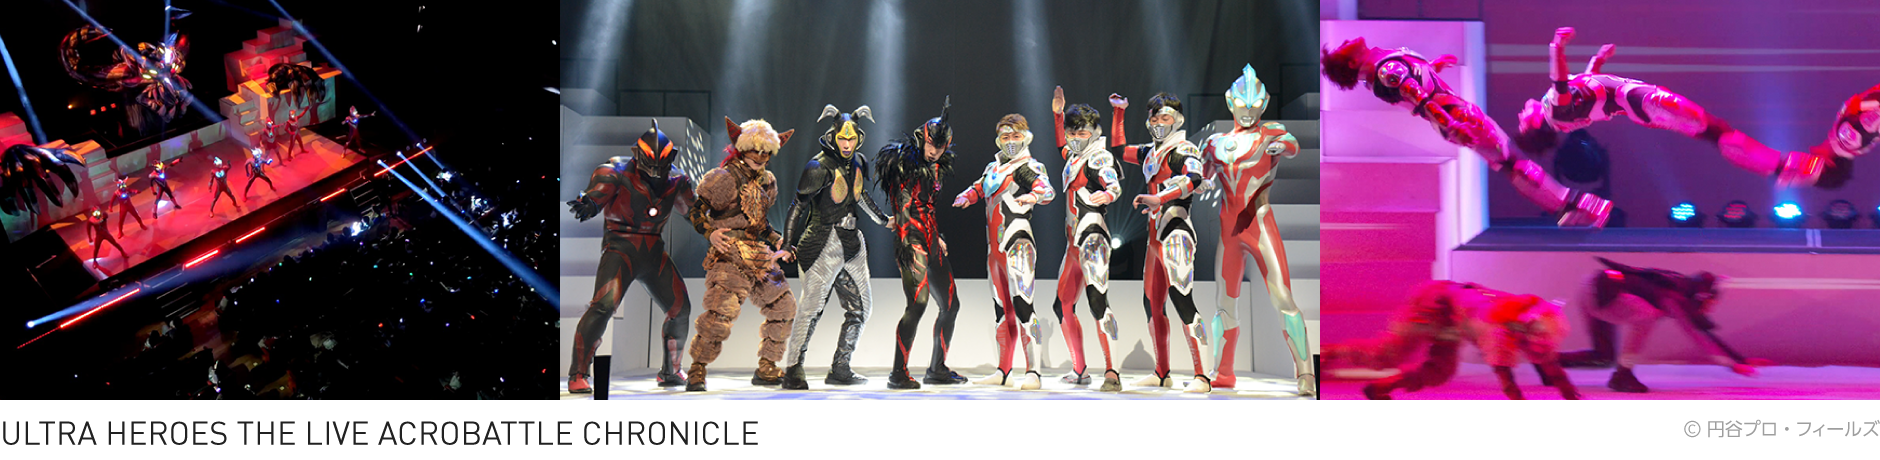
In FY03/16, we presented HEROES THE LIVE ACROBATTLE CHRONICLE shows as hands-on live entertainment leveraging the Ultraman series. This show was performed in Tokyo Osaka, Shizuoka and all major cities throughout Japan, as well as overseas in Hong Kong.
At present, we have announced ULTRA HEROES THE LIVE ACROBATTLE CHRONICLE 2016, which is scheduled to be performed in Osaka in September 2016, Nagoya in December and Tokyo in January 2017. Going forward, the Fields Group will continue to aggressively develop live entertainment shows in Japan while promoting planning and development overseas focused on Southeast Asia.
The character business, comprising IP merchandising and copyrights, involves the licensing of classic characters for new uses such as clothing for adults, movement that is invigorating the development of new markets in Japan and overseas.
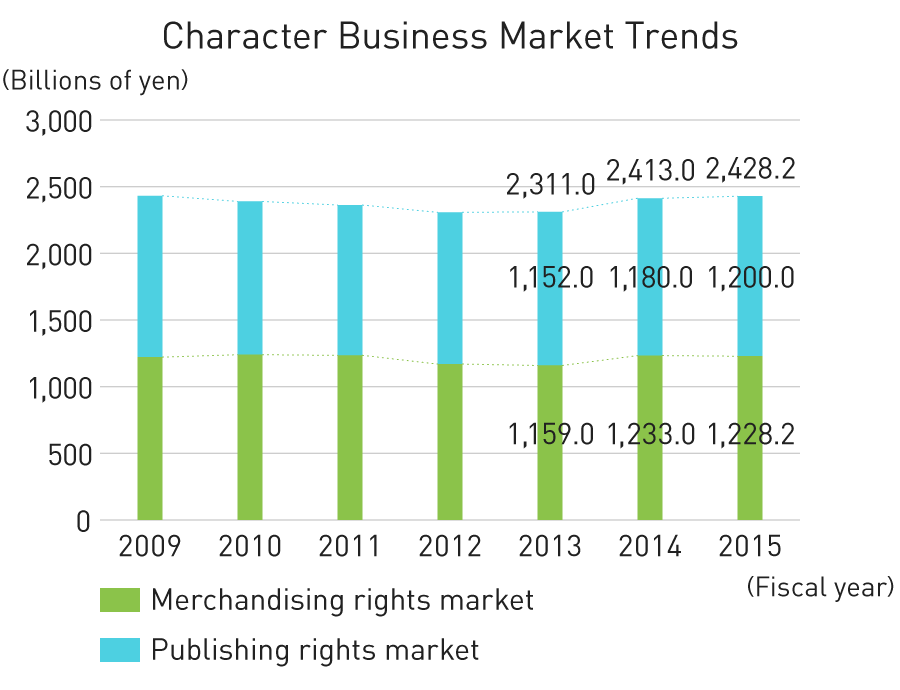
According to Yano Research Institute Ltd.’s Character Business 2016 research report, in fiscal 2015 the character business market amounted to ¥2,428.2 billion (up 0.6% YoY), up slightly but remaining mostly flat.
Toys, which account for a major share of the merchandise licensing market, struggled causing overall contraction. However, apparel and fashion accessories that promote the strengthening of products for adults performed well due to the success of efforts related to apparel worn by fashion models featuring characters from animation and other entertainment.
The copyrights market expanded significantly due to the enhanced rebranding of classic characters and the aggressive use of characters in sales promotions.
Source:
Yano Research Institute Ltd.’s Character Business 2016 research report.
Merchandising rights: The right to use characters for ancillary products. Calculated on a retail sales amount basis.
Copyrights: The right to use character images in published materials and advertising. Calculated on a contract amount basis.
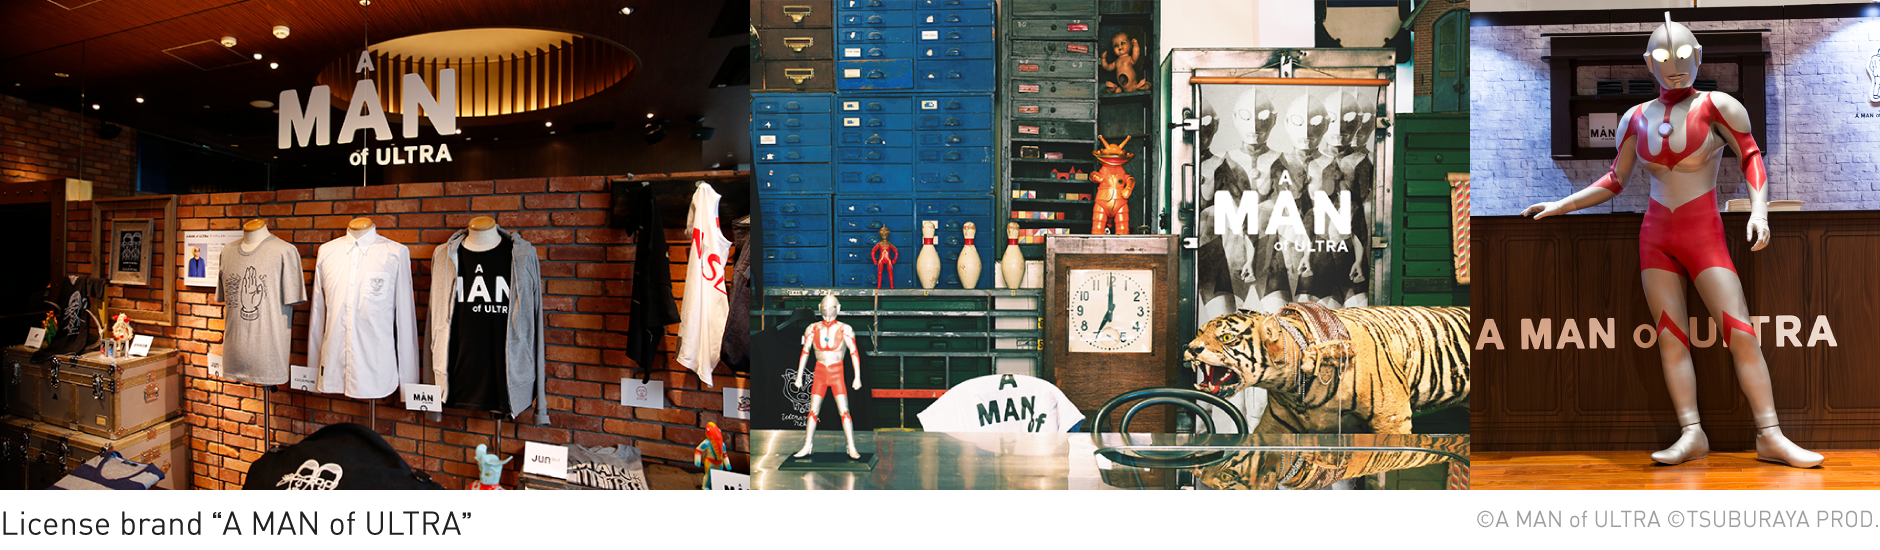
In FY03/16, Fields launched conceptual licensing of A MAN of ULTRA aimed at establishing a new licensing business and expanding the domain of our IP business. This brand goes beyond the framework of traditional character merchandising such as apparel, accessories, stationery, interior, food and music to target overall lifestyles.
In June 2016, this brand won the Japan Brand Licensing Award at the Grand Prix. Going forward, Fields plans on further accelerating these developments.
In the pachinko/pachislot field, our IP earnings foundation, the pachinko/pachislot sales market this fiscal year faced circumstances in which it was difficult to generate hits due to the impact from the implementation of new machine standards transition, thus the number of units sold and the market overall declined compared with the previous fiscal year.
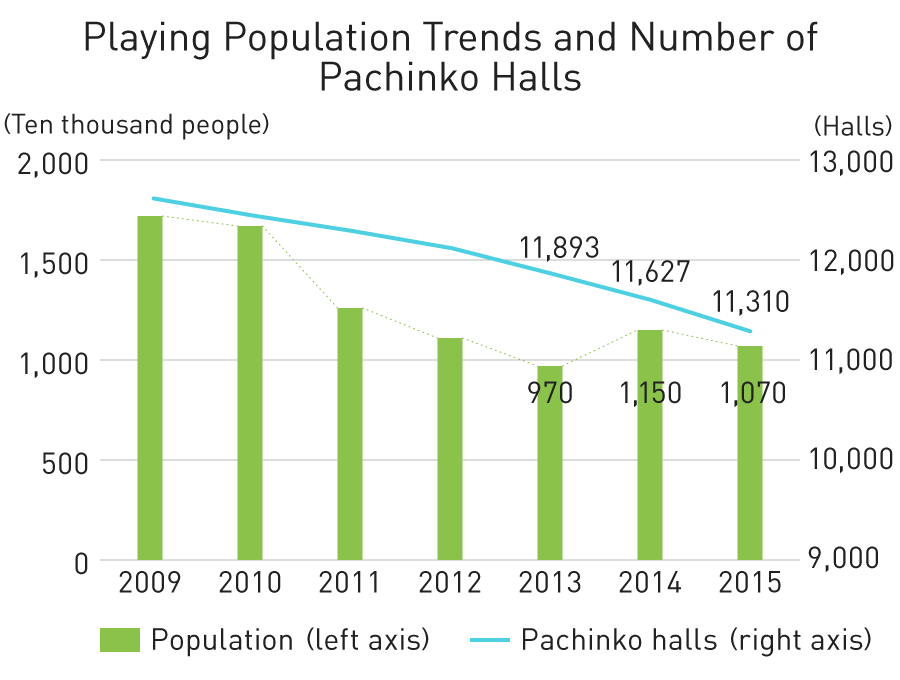
According to the Japan Productivity Center’s White Paper on Leisure 2016, the number of people (estimated) that played pachinko/pachislot in 2015 shrank by 800,000 people from the previous year to 10.7 million people.
Since 2009, when the number of people that played pachinko/pachislot was reported at 17.2 million, there has been a steady decline in the playing population, with 2013 numbers dipping below 10 million to 9.7 million people. In 2014, the first increase in five years saw an additional 1.8 million people drive numbers up 11.7 million, but in 2015 these numbers once again declined.
Source:
White Paper on Leisure 2016, Japan Productivity Center; 2015 White Paper on Adult Entertainment Businesses, National Police Agency.
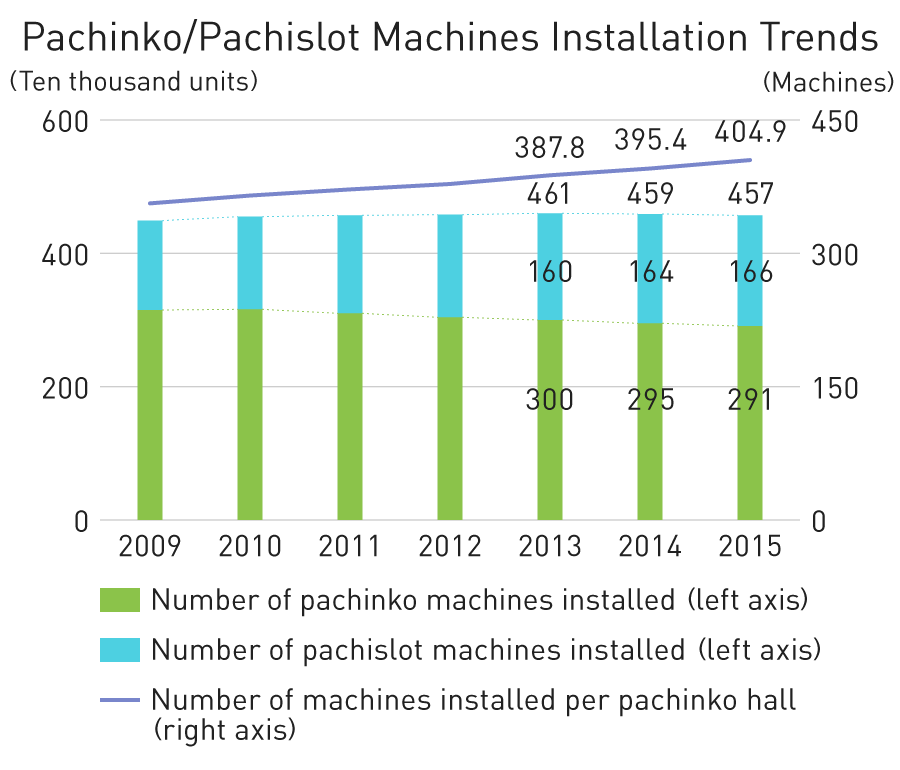
Trends in Number of Pachinko Halls and Pachinko/Pachislot Machines Installations
Statistical data released by the National Police Agency (NPA) indicates that the number of pachinko halls in Japan decreased by 317 compared to the previous year, to 11,310 in 2015. Although the number of pachinko/pachislot machines installed fell by 20,000 units, to 4.58 million, the number of machines installed per pachinko hall increased 9.5 units, to 404.9. This represents the continuing trend toward large-scale pachinko halls.
Source:
2015 White Paper on Adult Entertainment Businesses, National Police Agency.
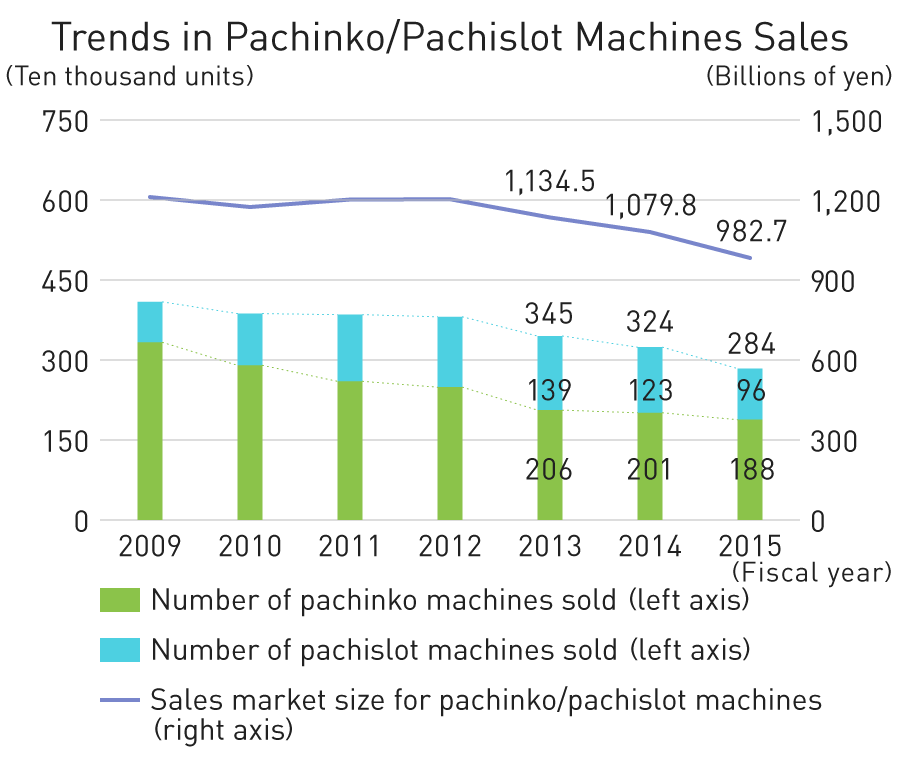
Trends in Pachinko/Pachislot Machines Sales
According to the Yano Research Institute Ltd.’s 2016 Trends and Market Share of Pachinko Related Manufacturers, pachinko machine sales were down 6.6% year-on-year, to 1.88 million units in 2015. Pachislot machine sales decreased 21.5%, to 0.96 million units. As a result, the total sales market for pachinko/pachislot machines declined 9.0%, to ¥982.7 billion, with the pachinko market decreasing 6.0%, to ¥613.0 billion, and the pachislot market down 13.5%, to ¥369.7 billion.
These trends can be attributed to major changes caused by development and sales schedule revisions implemented by manufacturers in response to voluntary regulations related to industry bodies’ announcement of changes in the model certification test method for pachislot machines instituted in September 2015.
Source:
2016 Trends and Market Share of Pachinko Related Manufacturers, Yano Research Institute Ltd.
In FY03/16, we made an effort to promote the sales of 17 machines under seven brands. As a result, year-on-year pachislot machine sales increased 29,000 units to 126,000 units, however, pachinko machine sales declined 140,000 units to 162,000 units. Total pachinko/pachislot machines sales decreased 110,000 units to 289,000 units.
As we continue promoting various measures to improve product appeal, enhance services as a distribution trading company and expand the number of players, we will focus efforts on the sale of highly entertaining and game characteristic products leveraging hero IP and leading IP from other companies.
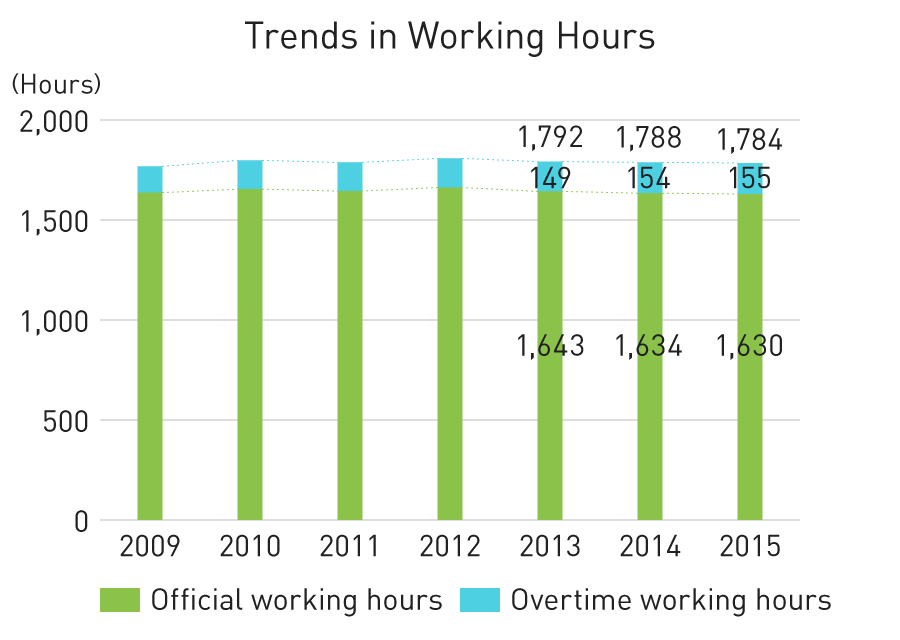
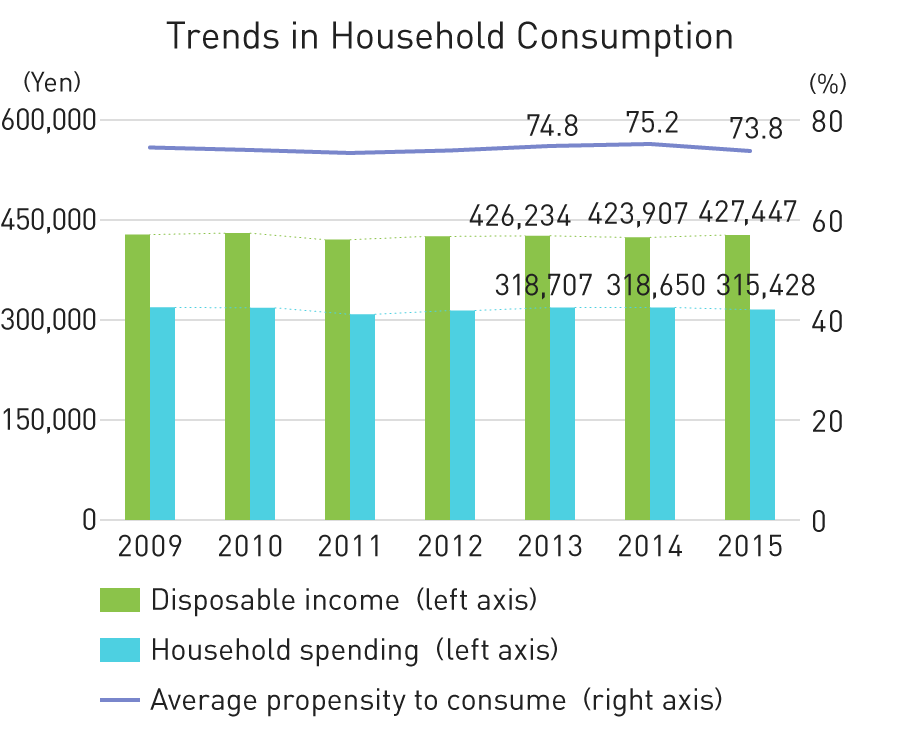
According to the Monthly Labour Survey conducted by Japan’s Ministry of Health, Labour and Welfare, the annual total for hours worked (the average for one person working in a company of 30 or more people) in 2015 decreased for the third consecutive year (decrease four hours YoY), to 1,784 hours. Official working hours nearly flat, down 0.0%, to 1,630 hours from last year which decreased for the second consecutive year. Meanwhile, overtime working hours decreased slightly, down 0.3%, to 155 hours from last year which increased for the third consecutive year. The increase in the ratio of part-time employees, who have shorter working hours, resulted in the reduction of overall working hours, while working hours for full-time employees decreased.
Note: In some cases, the calculation of year-on-year changes and indices do not match actual calculation figures. Also, index number and year-on-year changes have been retroactively revised in accordance with changes in sampling by the research office in January 2015. As a result, some of the year-on-year comparison calculations in the graph are incongruent with actual figures.
According to the Family Income and Expenditure Survey conducted by the Ministry of Internal Affairs and Communications, disposable income for a single household in Japan increased by ¥3,540 (up 0.8% YoY), to ¥427,447. At the same time, household spending (yearly average per month) in 2015 was down 1.0%, to ¥315,428, the second straight year of contraction, due to a decline in demand following the increase in purchases ahead of the consumption tax hike in 2014 as well as unseasonable summer weather.
As a result, the average propensity to consume, which represents the ratio of household spending to disposable income, declined for the first time in three years, down 1.4 points, to 73.8%.
Note: Some of the year-on-year comparison calculations in the graph are incongruent with actual figures due to the consideration of price fluctuations in actual figures.
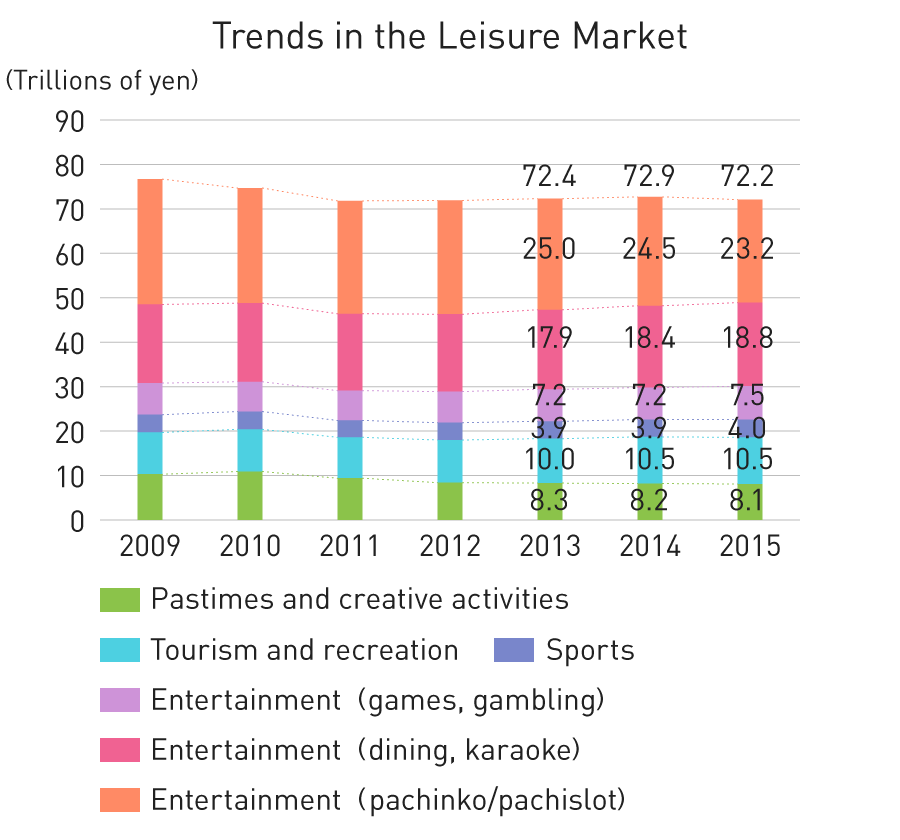
According to the Japan Productivity Center’s White Paper on Leisure 2016, the leisure market shrank 1.0% year-on-year, to ¥72,299.0 billion, in 2015. Excluding pachinko/pachislot, whose significant size distorts market scale, the market increased 1.2% for a third consecutive year of growth. This was driven by solid growth in domestic tourism, followed by an uptick in eating out and sporting goods.
The sports segment increased 1.9% year-on-year, to ¥4,024.0 billion, buoyed by sporting goods and sporting events, bringing the gradual recovery seen in recent years into clearer view.
The pastimes and creative activities segment declined 1.0% year-on-year, to ¥8,117.0 billion, dragged down by camera, video camera, book and magazine sales declines, resulting in the fifth consecutive year of contraction. However, the presence of e-books, fixed-price music distribution and paid video streaming services continues to expand.
Source:
White Paper on Leisure 2016, Japan Productivity Center.
The entertainment segment decreased 1.5% year-on-year, to ¥49,567.0 billion, on difficult condition surrounding pachinko/pachislot that caused a decline. At the same time, horse racing, bicycle racing, motorboat racing, lottery, sports betting and eating out remain solid.
The tourism and recreation segment increased 0.6% year-on-year, to ¥10,591.0 billion as hotels achieved record business for the third consecutive year and theme parks hit all-time highs for the second year in a row. Domestic tourism, rail and air transport were also solid, achieving a fourth consecutive year of growth.
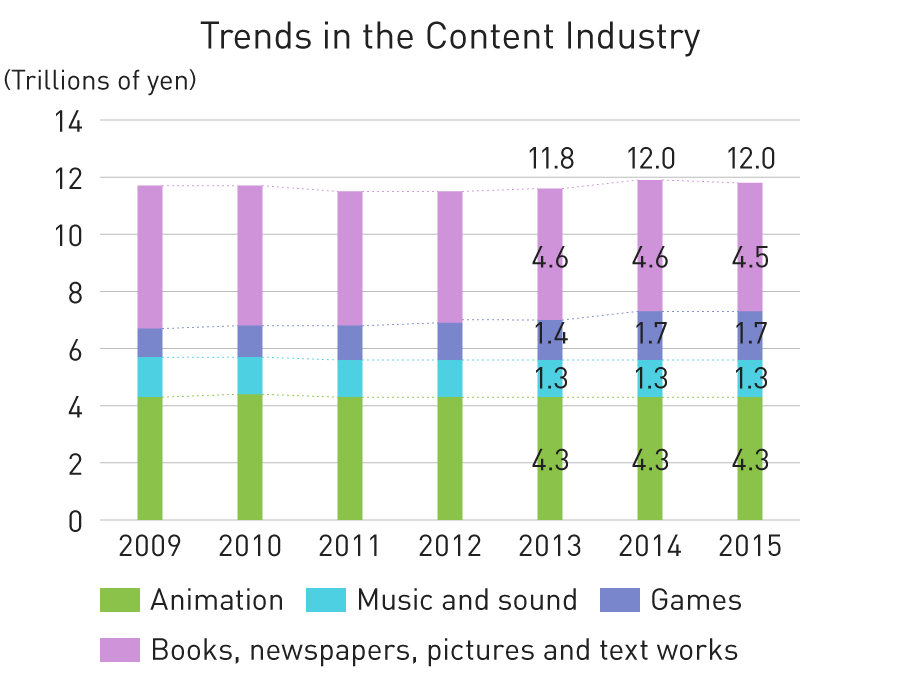
Trends in the Content Industry
According to the Digital Content Association of Japan’s White Paper on Digital Content 2016, the contents industry—comprising Japanese movies, animation, TV shows, games and books—edged up 0.4% year-on-year, to ¥12,050.5 billion.
In the visual segment, amid increases in network distribution, theatrical performances, movies and TV broadcasts, package sales continued to decline, resulting in a 0.7% increase year-on-year to ¥4,365.5 billion.
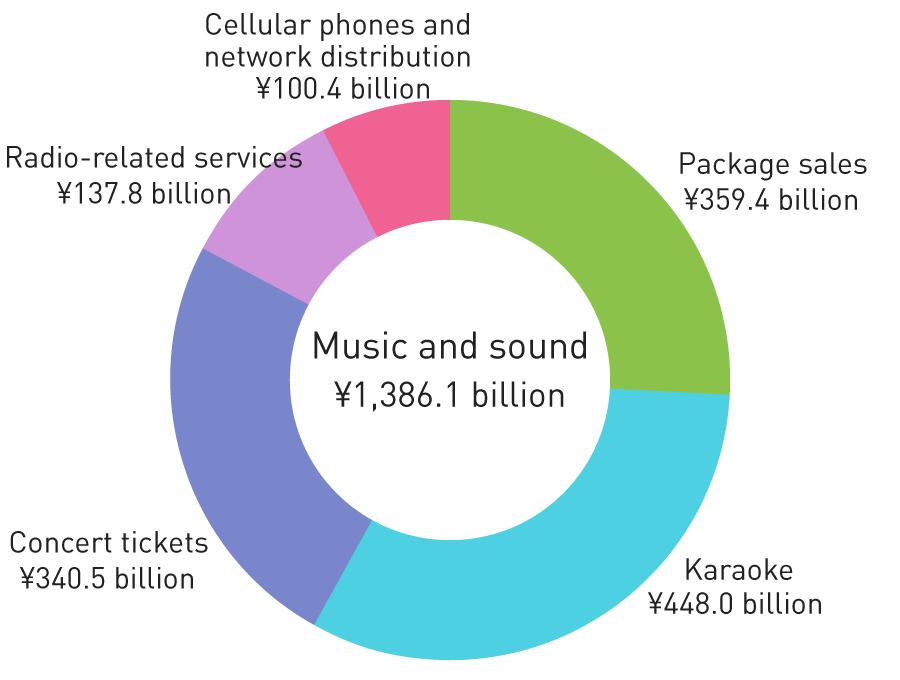
In the music and sound segment, concert attendance remained firm, growing for the eighth consecutive year, as music distribution increased slightly due to a decrease in feature phones and a substantial increase in network distribution. Package sales remained about the same as in the previous fiscal year but karaoke and radio-related services declined, resulting in a 3.7% increase year-on-year, to ¥1,386.1 billion, nearly the same as in the previous year.
Source:
White Paper on Digital Content 2016, Digital Content Association of Japan.
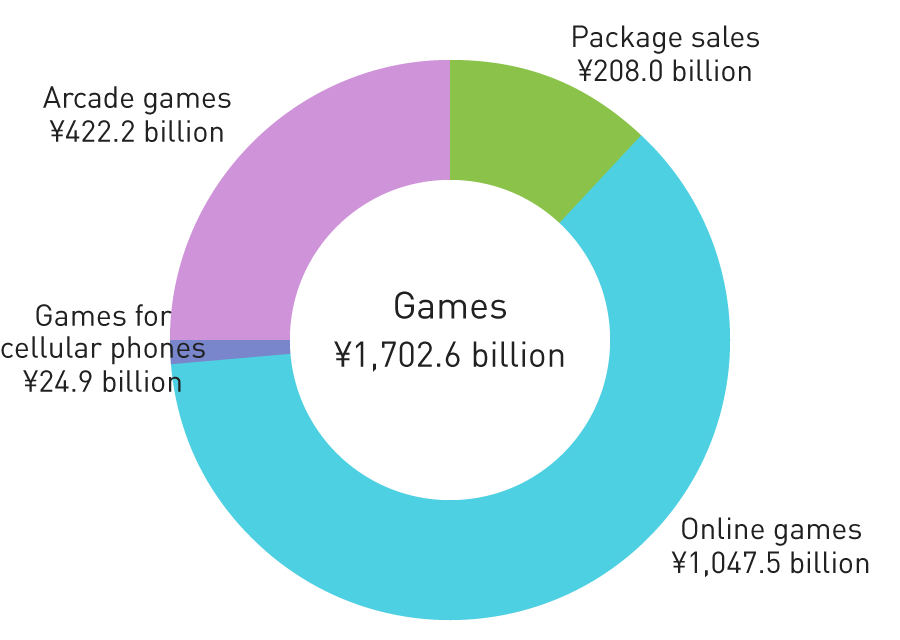
In the games segment, online games (for PCs and smartphones, excluding feature phones) grew at a modest rate topping ¥1 trillion. Package and arcade game sales as well as sales for feature phones continued on a downward trend, resulting in the first decline in the six years since 2009, down 0.9% year-on-year, to ¥1,702.6 billion.
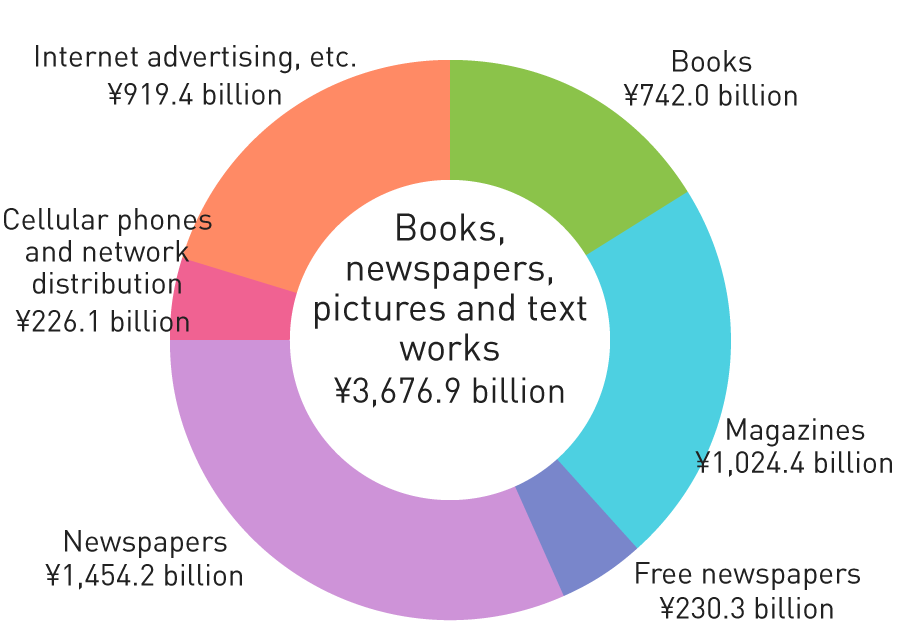
In the books, newspapers, pictures and text works segment, e-books and e-magazines grew significantly, while book sales declined for the ninth consecutive year and magazine sales were down for the 18th year straight, resulting in a decline of 2.9% year-on-year, to ¥3,676.9 billion.
Source:
White Paper on Digital Content 2016, Digital Content Association of Japan.
Publishing Market Trends
According to the White Paper on Digital Content 2016 published by the Digital Content Association of Japan, book sales in Japan amounted to ¥742.0 billion (down 1.7% YoY) and although this is a modest decline, it is the ninth consecutive year of negative growth. Hibana was the only book to become a million-seller.
Magazine sales amounted to ¥780.1 billion (down 8.4% YoY), the 18th consecutive year of declines representing the lowest sales ever. The magazine market decreased by approximately ¥72.0 billion in one year.
E-book sales expanded to ¥159.4 billion (up 24.4% YoY). Although sales for feature phones and PCs declined, sales for new platforms were substantially higher, easily covering the gap. E-magazine sales grew significantly to ¥24.2 billion (up 66.9% YoY).
Source:
White Paper on Digital Content 2016, Digital Content Association of Japan.
Video Market Trends
According to the White Paper on Digital Content 2016 published by the Digital Content Association of Japan, video sales amounted to ¥4,365.5 billion (up 0.7% YoY). Specifically, network distribution, movies, TV broadcasts and theatrical productions increased, while package sales continued to decline.
Network distribution (including feature phones) grew substantially to ¥141.0 billion (up 12.4% YoY). Since 2010, new entrants including overseas providers and mobile carriers as well as platform operator strategies have expanded the playing field for core fans of video content in the market through low-cost, fixed-price, multi-device plans and expanded content. Furthermore, the advance of SVOD, already established overseas, into the Japanese market has provided an opportunity to heighten recognition of video distribution as new players enter the market and invigorate business alliances.
Source:
White Paper on Digital Content 2016, published by the Digital Content Association of Japan.
Source:
Digital TV Research
Game Market Trends
According to the KADOKAWA DWANGO CORPORATION’s Famitsu Game White Paper 2016 the household game market decreased 10.8% year-on-year, to ¥360.1 billion (total of game hardware and software) in 2015. Meanwhile, the online platform game market (game apps for smartphones/tablets, games on SNS platforms for feature phones, and online PC games) jumped 26.7%, to ¥998.9 billion. As a result, the size of the game market in Japan reached a record-high ¥1,359.0 billion, up 14.0% year-on-year.
Source:
KADOKAWA DWANGO CORPORATION’s Famitsu Game White Paper 2016
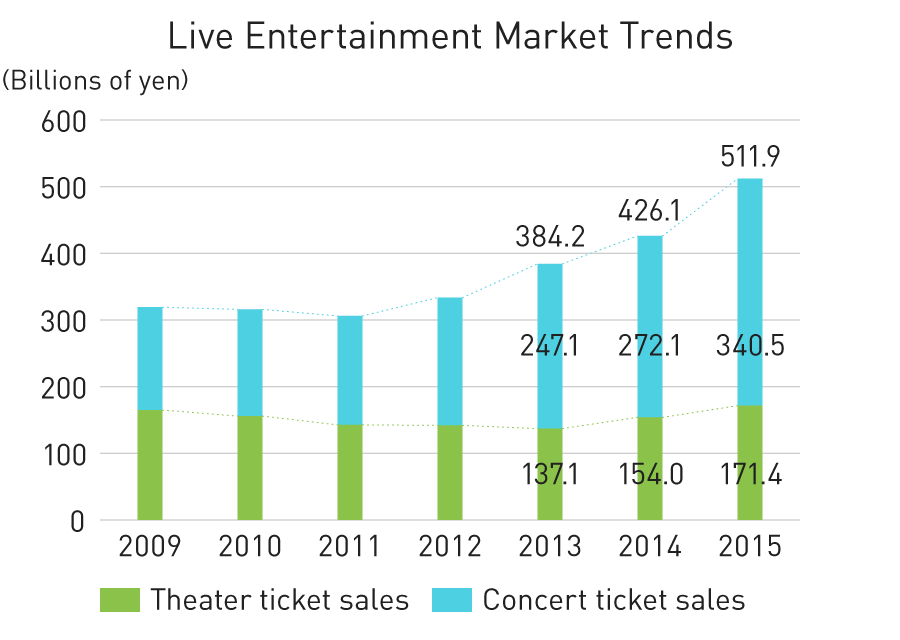
Live Entertainment Market Trends
According to the White Paper on Digital Content 2016 published by the Digital Content Association of Japan, the live entertainment market exhibited a high growth rate, expanding to ¥511.9 billion (up 20.1% YoY) in 2015.
Specifically, there was noteworthy growth in theater ticket sales which amounted to ¥171.4 billion (up 11.3% YoY) and, concert ticket sales, which amounted to ¥340.5 billion (up 25.2% YoY). Concert ticket sales scale and growth was particularly strong, increasing for the eighth consecutive year.
Source:
White Paper on Digital Content 2016, published by the Digital Content Association of Japan.
Character Business Market Trends
According to Yano Research Institute Ltd.’s Character Business 2016 research report, in fiscal 2015 the character business market amounted to ¥2,428.2 billion (up 0.6% YoY), up slightly but remaining mostly flat.
Toys, which account for a major share of the merchandise licensing market, struggled causing overall contraction. However, apparel and fashion accessories that promote the strengthening of products for adults performed well due to the success of efforts related to apparel worn by fashion models featuring characters from animation and other entertainment.
The copyrights market expanded significantly due to the enhanced rebranding of classic characters and the aggressive use of characters in sales promotions.
Source:
Yano Research Institute Ltd.’s Character Business 2016 research report.
Merchandising rights: The right to use characters for ancillary products. Calculated on a retail sales amount basis.
Copyrights: The right to use character images in published materials and advertising. Calculated on a contract amount basis.
Toy Market Trends
According to the Japan Toy Association, the size of the toy market in Japan in the fiscal year ended March 31, 2016, was ¥800.3 billion, down 1.0% year-on-year. This was nearly the same as the previous fiscal year, which was the largest the market had been in the past 10 years. In addition, the market for capsule toys, a peripheral field of the toy market, decreased 0.9% year-on-year, to ¥31.6 billion. The market for candy toys also decreased, down 21.1% year-on-year to ¥52.0 billion.
In fiscal 2015, sales of standard products including doll houses and doll toys increased along with a revival in the popularity of trading card games. However, characters for young boy children, stuffed animals, accessories and other small toys declined as demand bottomed out after the success of character-related products for young children in the previous year.
Source:
Data released by the Japan Toy Association
Pachinko/Pachislot Market Trends
Playing Population Trends
According to the Japan Productivity Center’s White Paper on Leisure 2016, the number of people (estimated) that played pachinko/pachislot in 2015 shrank by 800,000 people from the previous year to 10.7 million people.
Since 2009, when the number of people that played pachinko/pachislot was reported at 17.2 million, there has been a steady decline in the playing population, with 2013 numbers dipping below 10 million to 9.7 million people. In 2014, the first increase in five years saw an additional 1.8 million people drive numbers up 11.7 million, but in 2015 these numbers once again declined.
Source:
White Paper on Leisure 2016, Japan Productivity Center; 2015 White Paper on Adult Entertainment Businesses, National Police Agency.
Trends in Number of Pachinko Halls and Pachinko/Pachislot Machines Installations
Statistical data released by the National Police Agency (NPA) indicates that the number of pachinko halls in Japan decreased by 317 compared to the previous year, to 11,310 in 2015. Although the number of pachinko/pachislot machines installed fell by 20,000 units, to 4.58 million, the number of machines installed per pachinko hall increased 9.5 units, to 404.9. This represents the continuing trend toward large-scale pachinko halls.
Source:
2015 White Paper on Adult Entertainment Businesses, National Police Agency.
Trends in Pachinko/Pachislot Machines Sales
According to the Yano Research Institute Ltd.’s 2016 Trends and Market Share of Pachinko Related Manufacturers, pachinko machine sales were down 6.6% year-on-year, to 1.88 million units in 2015. Pachislot machine sales decreased 21.5%, to 0.96 million units. As a result, the total sales market for pachinko/pachislot machines declined 9.0%, to ¥982.7 billion, with the pachinko market decreasing 6.0%, to ¥613.0 billion, and the pachislot market down 13.5%, to ¥369.7 billion.
These trends can be attributed to major changes caused by development and sales schedule revisions implemented by manufacturers in response to voluntary regulations related to industry bodies’ announcement of changes in the model certification test method for pachislot machines instituted in September 2015.
Source:
2016 Trends and Market Share of Pachinko Related Manufacturers, Yano Research Institute Ltd.
Explanation of Recent Pachinko/Pachislot Machine Market Regulations and Other Developments
In August 2014, the National Police Agency (NPA) informed industry bodies of partial changes in the model certification test method for pachislot machines. These changes were implemented about two weeks after this announcement.
Along with this, several announcements were made by industry bodies pertaining to pachislot machine specifications requiring design reviews in multiple areas as well as the date by which these changes had to be implemented and sales timeframes.
About this time, in March 2015, industrial bodies announced “initiatives to restrict gambling” affecting pachinko machines. Multiple requirements were established, including the date by which these measures had to be implemented and sales timeframes.
As a result, the market fell into disarray due to a significant drop in the number of machines conforming to tests and plunging sales caused by sales concentration and during and after the sales timeframe.
Faced with these conditions, Fields collaborated with each of our affiliated manufacturers as a distribution and trading company handling multiple brands to pursue responses and countermeasures including the review and development of new specifications and streamlined sales lineups.
As a result, five pachislot machines in the previous fiscal year and two pachinko/pachislot machines in the fiscal year under review were postponed until next fiscal year.
Pachislot Regulatory Trends
Pachinko Regulatory Trends
Company and product names and service names in this document are the trademarks or registered trademarks of their respective companies.