The Environment Surrounding Leisure
Trends in Working Hours
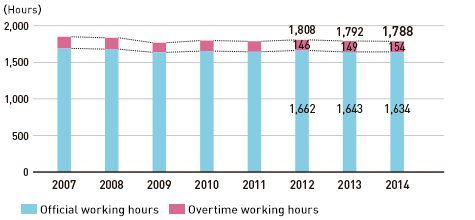
According to the Monthly Labour Survey conducted by Japan’s Ministry of Health, Labour and Welfare, the annual total for hours worked (the average for one person working in a company of 30 or more people) in 2014 decreased 0.2% year-on-year, to 1,788 hours. Official working hours decreased for the second consecutive year, down 0.5%, to 1,634 hours. Meanwhile, overtime working hours increased for the third consecutive year, up 3.4%, to 154 hours. The increase in the ratio of part-time employees, who have shorter working hours, resulted in the reduction of overall working hours, while working hours for full-time employees increased.
In addition, both official and overtime working hours in 2009 decreased substantially, primarily in the manufacturing industry, due to the impact of the financial crisis in the fall of the previous year.
Trends in Working Hours
Source: Monthly Labour Survey,
Ministry of Health, Labour and Welfare
Trends in Household Consumption
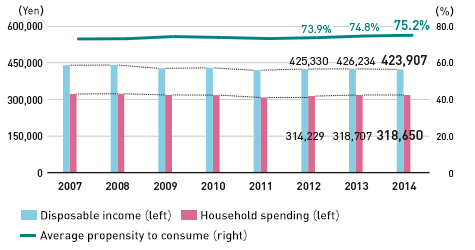
According to the Family Income and Expenditure Survey conducted by the Ministry of Internal Affairs and Communications, disposable income (yearly average per month) for a single household in Japan (households of two or more people with average number of people per household of 3.39, excluding agricultural, forestry, and fishing households) decreased 0.5% year-on-year, to ¥423,907. Household spending (yearly average per month) was down 0.02%, to ¥318,650. As a result, the average propensity to consume, which represents the ratio of household spending to disposable income, rose for the third consecutive year, up 0.4 points, to 75.2%.
Both disposable income and household spending decreased following the impact of economic stagnation due to the consumption tax rate rising to 8% in 2014.
Trends in Household Consumption
Source: Family Income and Expenditure Survey,
Ministry of Internal Affairs and Communications
Trends in the Leisure Market
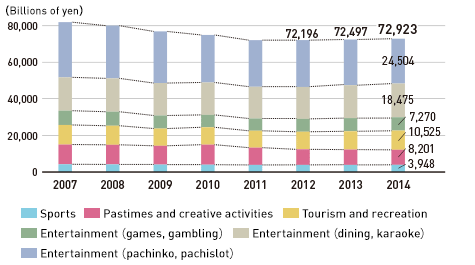
According to the Japan Productivity Center’s White Paper on Leisure 2015, the leisure market edged up 0.6% year-on-year, to ¥72,923 billion, in 2014. Growth was particularly strong in the domestic tourism and recreation markets, such as domestic travel, hotels, and amusement and theme parks, which increased 4.5% year-on-year, to ¥6,756 billion. With a growth rate of over 4.0% for the second consecutive year, this sector helped drive overall growth for the leisure market. Growth in this sector reflected an 11.0% year-on-year increase in the hotel market, to ¥1,201 billion, which was attributable to the increase in the number of foreign tourists due to the impact of yen depreciation. This growth also reflected a 2.3% increase in the amusement and theme park market, to a record high of ¥741 billion, brought about by the rising demand for interactive recreation.
In addition, the effects of consumption for interactive activities spread to music-related markets. The market size for musical entertainment, such as live performances and events, was ¥346 billion, up 13.1% year-on-year, and surpassed the CD market (including rentals) for the first time ever.
As the demand for interactive recreation continues to rise, all companies in the leisure industry are implementing initiatives to attract customers.
In regard to the pachinko and pachislot market, which accounts for approximately 30% of Japan’s leisure market, the Japan Productivity Center made retrospective revisions to market size estimates. Based on these new estimations, the pachinko and pachislot market decreased 2.0% year-on-year, to ¥24,504 billion.
Trends in the Leisure Market
Source: White Paper on Leisure 2015,
Japan Productivity Center
Trends in the Content Industry
As stated in the Ministry of Economy, Trade and Industry (METI)’s Current Status and Future Development Trends of the Contents Industry (July 2015), the Japanese contents industry is an up-and-coming industry, with growth anticipated from overseas development. In addition, it is believed to have a significant economic impact toward non-contents industries such as the manufacturing industry. It is also believed that leveraging the value of Japanese contents to acquire profits from overseas will be extremely important in order to realize sustainable growth going forward.
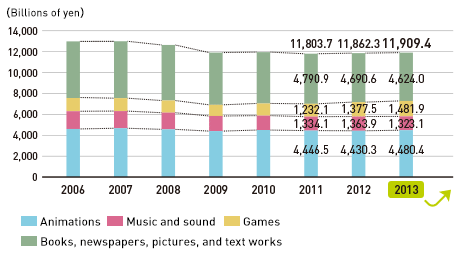
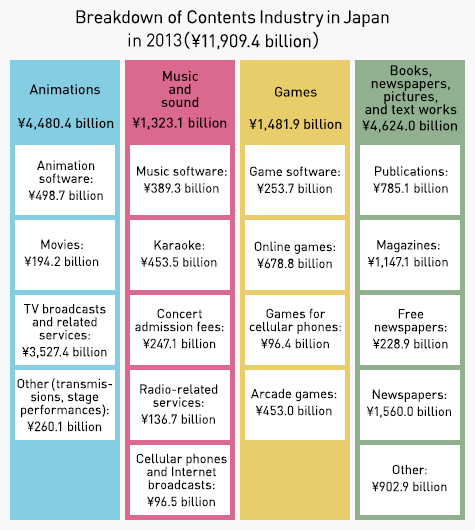
According to the Digital Content Association of Japan’s White Paper on Digital Content 2014, the contents industry—comprising Japanese movies, anime, TV shows, games, and books—was approximately unchanged year-on-year, edging up 0.4% in 2013, to ¥11,909.4 billion, making it the second largest contents industry in the world next to the United States. Although growth in the industry in recent years has leveled off due to Japan’s declining population, the industry is anticipating growth from overseas development going forward through the METI-promoted “Cool Japan Strategy.”
Trends in the Content Industry
Source: White Paper on Digital Content 2014,
Digital Content Association of Japan
Market Trends: Pachinko and Pachislot
1. Trends in Playing Population
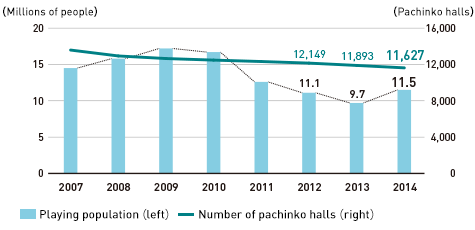
According to the Japan Productivity Center’s White Paper on Leisure 2015, the number of people (estimated) that played pachinko and pachislot in 2014 rebounded to 11.5 million, an increase of 1.8 million from the previous year, where the number of people playing was under 10.0 million. The main reasons for this increase were an economic recovery that helped boost the overall population participating in the leisure industry and the increase in halls that operate with low playing costs in the pachinko and pachislot market.
Trends in Playing Population/Number of Pachinko Halls
Source: White Paper on Leisure 2015, Japan Productivity Center and
2014 White Paper on Adult Entertainment Businesses,
National Police Agency
2. Trends in Number of Pachinko Halls and Pachinko and Pachislot Machines Installations
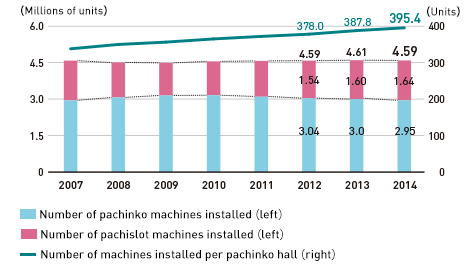
Statistical data released by the National Police Agency (NPA) indicates that the number of pachinko halls in Japan decreased by 266 compared to the previous year, to 11,627 in 2014. Although the number of pachinko and pachislot machines installed fell 13,000 units, to 4.59 million, the number of machines installed per pachinko hall increased 7.6 units, to 395.4. This represents the continuing trend toward large-scale pachinko halls.
Trends in Pachinko and Pachislot Machines Installations
Source: 2014 White Paper on Adult Entertainment Businesses,
National Police Agency
3. Trends in Pachinko and Pachislot Machines Sales
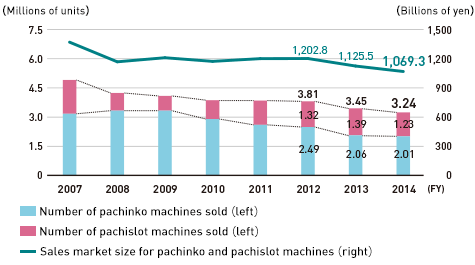
According to the Yano Research Institute Ltd.’s 2015 Trends and Market Share of Pachinko Related Manufacturers, pachinko machine sales were down 2.4% year-on-year, to 2.01 million units in 2014. Pachislot machine sales decreased 11.1%, to 1.23 million units. As a result, the total sales market for pachinko and pachislot machines declined 5.0%, to ¥1,069.3 billion, with the pachinko market decreasing 1.1%, to ¥643.7 billion, and the pachislot market down 10.3%, to ¥425.6 billion.
These trends can largely be attributed to the sales schedule revisions implemented by several manufacturers in response to the change in the model certification test method for pachislot machines instituted in September 2014.
Trends in Pachinko and Pachislot Machines Sales
Source: 2015 Trends and Market Share of Pachinko Related Manufacturers,
Yano Research Institute Ltd.
4. Trends in Regulations
In September 2014, the Security Communications Association made changes to the pachislot model certification test method. Previously, the voluntary payout method required a minimum payout rate of 55%, or more than 11 medals for every 20 medals inserted. After these changes, this same condition now applies to the payout method with the lowest payout rates.
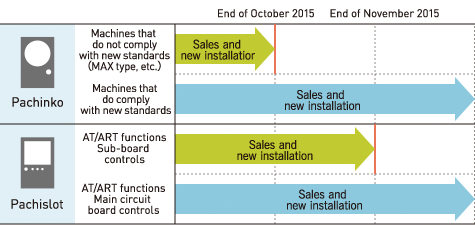
In the same month, Nichidenkyo, an association of pachislot manufacturers, placed restrictions on equipping penalty functions in pachislot machines in response to these changes. The association also announced voluntary regulations related to main circuit board transfers for AT/ART functions. As a result, after December 2015 it will only be possible to sell or install pachislot machines that participate in these new standards, which place importance on entertainment over gambling.
Meanwhile, in regard to pachinko machines, Nikkoso, an association of pachinko manufacturers, announced voluntary regulations in March 2015 that set the lower limit for the probability of winning a big jackpot at once per 320 spins of in-machine slot reels (currently once per 400 spins) in consideration of the expectations of the NPA. As a result, the period for which it is possible to sell or install so-called “MAX (high spec) type” machines, which are currently in operation, will be until the end of October 2015. From November 2015, it will only be possible to sell or install pachinko machines that participate in these new standards.
Period for Sales and Installation of Pachinko and Pachislot Machines
Market Trends: Games
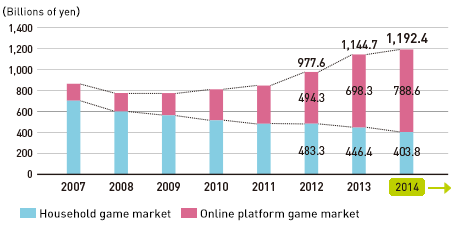
The KADOKAWA DWANGO CORPORATION’s White Paper on Famitsu Games 2015 states that the household game market decreased 9.5% year-on-year, to ¥403.8 billion (total of game hardware and software) in 2014. Meanwhile, the online platform game market (game apps for smartphones/tablets, games on SNS platforms for feature phones, and online PC games) increased 12.9%, to ¥788.6 billion. As a result, the size of the game market in Japan reached a record-high ¥1,192.4 billion, up 4.2% year-on-year.
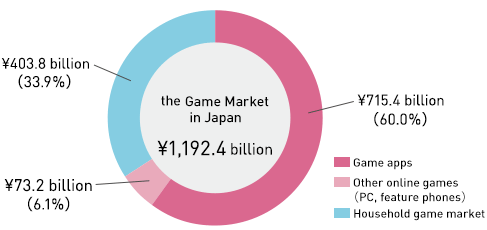
Within the online platform game market, the size of the game app market (game apps for smartphones/tablets and games on SNS platforms for feature phones) increased 17.9% year-on-year, to ¥715.4 billion, accounting for approximately 60% of the domestic game market and helping to drive its expansion.
Trends in the Game Market
Breakdown of the Game Market in 2014
Source: White Paper on Famitsu Games 2015,
KADOKAWA DWANGO CORPORATION
Market Trends: Toys
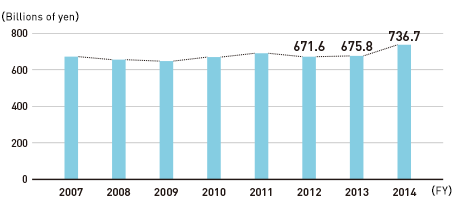
According to the Japan Toy Association, the size of the toy market in Japan in the fiscal year ended March 31, 2015, was ¥736.7 billion, up 9.0% compared to the previous fiscal year. This is the largest the market has been in the past 10 years. In addition, the market for capsule toys, a peripheral field of the toy market, increased 14.7% year-on-year, to ¥31.9 billion. The market for candy toys also increased substantially, to ¥65.9 billion, up 17.0% year-on-year.
The main reasons behind these increases were the success of character-related products, which became extremely popular especially among young children, and the rising popularity of products related to anime movies, which achieved record-breaking success around the world. These have had synergistic effects in the extensive development of the peripheral field of toys, such as capsule toys, candy toys, and video games, helping improve their popularity.
Size of the Toy Market
Source: Data released by the Japan Toy Association