Consolidated Financial Highlights
FIELDS CORPORATION and its Consolidated Subsidiaries
| Year Ended March 31, 2009 | Year Ended March 31, 2010 | Year Ended March 31, 2011 | Year Ended March 31, 2012 | Year Ended March 31, 2013 | Year Ended March 31, 2014 | |||||||
|---|---|---|---|---|---|---|---|---|---|---|---|---|
| Results of Operations (Millions of Yen): | YoY Change (%) |
YoY Change (%) |
YoY Change (%) |
YoY Change (%) |
YoY Change (%) |
YoY Change (%) |
||||||
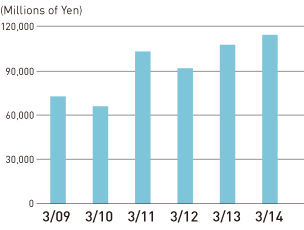
| Net sales | ¥73,035 | (28.3) | ¥66,342 | (9.2) | ¥103,593 | 56.2 | ¥92,195 | (11.0) | ¥108,141 | 17.3 | ¥114,904 | 6.3 |
| Gross profit | 24,024 | (30.5) | 26,889 | 11.9 | 35,129 | 30.6 | 31,330 | (10.8) | 33,279 | 6.2 | 33,812 | 1.6 |
| Gross profit margin (%) | 32.9 | 40.5 | 33.9 | 34.0 | 30.8 | 29.4 | ||||||
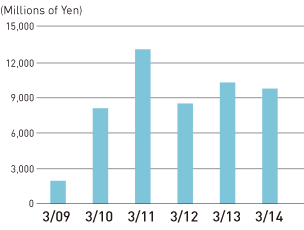
| Operating income | 1,960 | (85.1) | 8,124 | 314.3 | 13,136 | 61.7 | 8,527 | (35.1) | 10,314 | 21.0 | 9,791 | (5.1) |
| Operating margin (%) | 2.7 | 12.2 | 12.7 | 9.2 | 9.5 | 8.5 | ||||||
| Ordinary income*1 | 991 | (91.5) | 7,761 | 682.9 | 13,684 | 76.3 | 8,661 | (36.7) | 10,268 | 18.6 | 9,765 | (4.9) |
| Ordinary margin (%) | 1.4 | 11.7 | 13.2 | 9.4 | 9.5 | 8.5 | ||||||
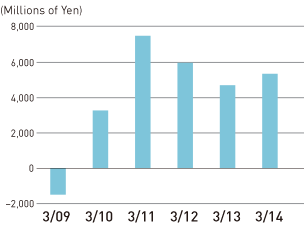
| Net income (loss) | (1,481) | — | 3,289 | — | 7,520 | 128.6 | 5,991 | (20.3) | 4,720 | (21.2) | 5,370 | 13.7 |
| Net margin (%) | — | 5.0 | 7.3 | 6.5 | 4.4 | 4.7 | ||||||
| Financial Position (Millions of Yen): | YoY Change |
YoY Change |
YoY Change |
YoY Change |
YoY Change |
YoY Change |
||||||
| Total assets | 52,064 | (17,103) | 81,329 | 29,264 | 78,971 | (2,357) | 93,601 | 14,630 | 106,628 | 13,026 | 104,869 | (1,758) |
| Total net assets | 39,496 | (6,835) | 41,187 | 1,690 | 47,021 | 5,834 | 51,555 | 4,533 | 55,098 | 3,543 | 58,753 | 3,654 |
| Shareholders’ equity | 39,463 | (5,022) | 41,064 | 1,601 | 46,779 | 5,714 | 51,071 | 4,291 | 54,559 | 3,487 | 58,279 | 3,720 |
| Interest-bearing liabilities | 3,011 | (1,995) | 2,230 | (781) | 1,834 | (395) | 1,660 | (172) | 1,052 | (609) | 743 | (308) |
| Cash Flows (Millions of Yen): | YoY Change |
YoY Change |
YoY Change |
YoY Change |
YoY Change |
YoY Change |
||||||
| Cash flows from operating activities | 4,147 | (6,980) | 8,429 | 4,281 | 8,005 | (424) | 10,015 | 2,010 | 13,570 | 3,554 | 16,322 | 2,752 |
| Cash flows from investing activities | (6,182) | 8,421 | (1,011) | 5,171 | (4,356) | (3,344) | (4,798) | (441) | (6,263) | (1,465) | (8,018) | (1,754) |
| Cash flows from financing activities | 602 | 1,986 | (2,687) | (3,290) | (3,915) | (1,227) | (2,565) | 1,349 | (2,277) | 288 | (2,018) | 258 |
| Free cash flow | (2,035) | 1,441 | 7,418 | 9,452 | 3,649 | (3,769) | 5,217 | 1,568 | 7,307 | 2,088 | 8,303 | 997 |
| Per Share Data (Yen)*2: | ||||||||||||
| Basic earnings (loss) per share | ¥(4,271) | ¥9,796 | ¥22,643 | ¥18,044 | ¥142.27 | ¥161.83 | ||||||
| Net assets per share | 117,326 | 123,645 | 140,853 | 153,904 | 1,644.15 | 1,756.27 | ||||||
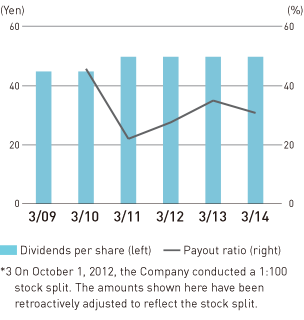
| Dividends per share | 4,500 | 4,500 | 5,000 | 5,000 | 50 | 50 | ||||||
| Key Financial Indicators (%): | ||||||||||||
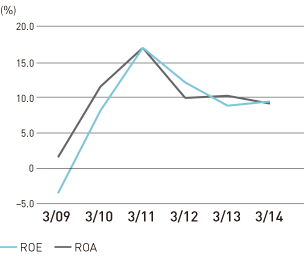
| Return (loss) on equity (ROE) | (3.5) | 8.2 | 17.1 | 12.2 | 8.9 | 9.5 | ||||||
| Return on assets (ROA) | 1.6 | 11.6 | 17.1 | 10.0 | 10.3 | 9.2 | ||||||
| Shareholders’ equity ratio | 75.8 | 50.5 | 59.2 | 54.6 | 51.2 | 55.6 | ||||||
| Payout ratio | — | 45.9 | 22.1 | 27.7 | 35.1 | 30.9 | ||||||
| Number of Employees | 827 | 909 | 1,149 | 1,324 | 1,416 | 1,588 | ||||||
Figures in parentheses in the table are negative.
*1 Ordinary income is used as one of the important performance indicators in Japanese GAAP. This classification consists of the addition of the balance of financial income, such as interest income (expense), foreign exchange gain (loss) etc., to operating income.
*2 On October 1, 2012, the Company conducted a 1:100 stock split. Amounts for the fiscal year ended March 31, 2013, and thereafter reflect the stock split.
| Year Ended March 31, 2009 | Year Ended March 31, 2010 | Year Ended March 31, 2011 | Year Ended March 31, 2012 | Year Ended March 31, 2013 | Year Ended March 31, 2014 | |||||||
|---|---|---|---|---|---|---|---|---|---|---|---|---|
| Pachinko/Pachislot Machine Unit Sales | YoY Change |
YoY Change |
YoY Change |
YoY Change |
YoY Change |
YoY Change |
||||||
| Number of pachinko/pachislot machines sold | 331,205 | (153,329) | 449,880 | 118,675 | 480,273 | 30,393 | 412,390 | (67,883) | 328,110 | (84,280) | 392,982 | 64,872 |
| By type | ||||||||||||
| Pachinko machines | 202,525 | (71,456) | 330,734 | 128,209 | 262,614 | (68,120) | 233,223 | (29,391) | 99,993 | (133,230) | 162,879 | 62,886 |
| Pachislot machines | 128,680 | (81,873) | 119,146 | (9,534) | 217,659 | 98,513 | 179,167 | (38,492) | 228,117 | 48,950 | 230,103 | 1,986 |
Net Sales
Operating Income
Net Income (Loss)
ROE / ROA
Dividends per Share*3 / Payout Ratio