Review of Fields’ Business Activities
Performance Overview
Consolidated Performance Highlights
Millions of Yen
| Year Ended March 31, 2012 |
Year Ended March 31, 2013 |
Year Ended March 31, 2014 |
Year Ending March 31, 2015 (Forecast) |
|
|---|---|---|---|---|
| Net sales | 92,195 | 108,141 | 114,904 | 100,000 |
| Year on year (%) | 89.0 | 117.3 | 106.3 | 87.0 |
| Ratio to net sales (%) | 100.0 | 100.0 | 100.0 | 100.0 |
| Gross profit | 31,330 | 33,279 | 33,812 | — |
| Year on year (%) | 89.2 | 106.2 | 101.6 | — |
| Ratio to net sales (%) | 34.0 | 30.8 | 29.4 | — |
| Selling, general and administrative expenses |
22,803 | 22,964 | 24,020 | — |
| Year on year (%) | 103.7 | 100.7 | 104.6 | — |
| Ratio to net sales (%) | 24.7 | 21.2 | 20.9 | — |
| Operating income | 8,527 | 10,314 | 9,791 | 5,000 |
| Year on year (%) | 64.9 | 121.0 | 94.9 | 51.1 |
| Ratio to net sales (%) | 9.2 | 9.5 | 8.5 | 5.0 |
| Ordinary income*1 | 8,661 | 10,268 | 9,765 | 5,000 |
| Year on year (%) | 63.3 | 118.6 | 95.1 | 51.2 |
| Ratio to net sales (%) | 9.4 | 9.5 | 8.5 | 5.0 |
| Net income | 5,991 | 4,720 | 5,370 | 2,500 |
| Year on year (%) | 79.7 | 78.8 | 113.7 | 46.6 |
| Ratio to net sales (%) | 6.5 | 4.4 | 4.7 | 2.5 |
| Shareholders’ equity ratio (%) | 54.6 | 51.2 | 55.6 | — |
| Return on equity (ROE) (%) | 12.2 | 8.9 | 9.5 | — |
| Return on assets (ROA) (%) | 10.0 | 10.3 | 9.2 | — |
| Dividends per share (Yen)*2 | 50 | 50 | 50 | 50 |
| Payout ratio (%) | 27.7 | 35.1 | 30.9 | 66.4 |
*1 Ordinary income is used as one of the important performance indicators in Japanese GAAP. This classification consists of the addition of the balance of financial income, such as interest income (expense), foreign exchange gain (loss) etc., to operating income.
*2 On October 1, 2012, the Company conducted a 1:100 stock split. The amounts shown here have been retroactively adjusted to reflect the stock split.
1 Development of Pachinko and Pachislot Business —The Group’s Earnings Mainstay
In the pachinko and pachislot business, which is our earnings mainstay, we are taking a range of steps to provide high-quality products stably, keep existing fans, and attract new customers.
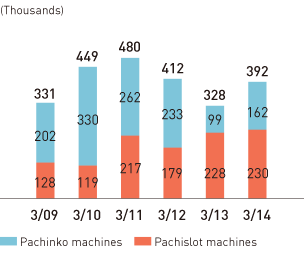
In the fiscal year ended March 31, 2014, pachinko machine unit sales rose approximately 63,000 units year on year, to 163,000 units, thanks to the release of the latest installment of the Evangelion series and others. Meanwhile, adding Mizuho brand products to the lineup boosted pachislot machine unit sales approximately 2,000 units year on year, to the record level of 230,000 units.
Number of Machines Sold
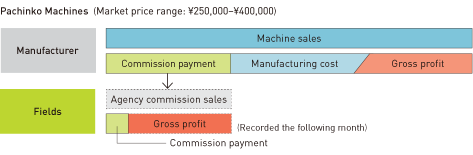
2 Differences in Recording for Pachinko and Pachislot Machines
The sales formats for pachinko and pachislot machines are different. Pachinko machines are based on commission sales and the Company receives a commission from the manufacturer for every machine sold to pachinko halls. These commissions are recorded as sales.
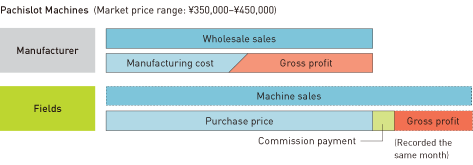
By contrast, pachislot machines are based on direct sales with the price of the machine sold to pachinko halls recorded as sales and that amount minus our purchase price recorded as gross profit.
In other words, because sales per unit are higher for pachislot machines, an increase in unit sales of pachislot machines contributes to higher sales. However, an increase in unit sales of pachinko machines contributes to a higher profit margin.
3 Causes of Change in Operating Income
- In pachinko and pachislot machine sales, earnings rose because solid sales counteracted costs arising from strengthening the sales system and stepped-up sales promotion activities. At the same time, we increased collaborative development of pachinko and pachislot machines with subsidiaries to expand and improve the product lineup over the medium-to-long term.
- In the consumer products field, we are building a system that will enable Tsuburaya Productions Co., Ltd., which owns the Ultraman series, to generate stable earnings. In the fiscal year ended March 31, 2014, earnings increased due to the favorable performance of the license business as a result of 50th anniversary events and the rollout of a new TV series.
- In the interactive media field, popular content provided by ongoing services performed steadily. On the other hand, in response to the rapid shift in distribution formats from web apps to native apps in the social game market, we reformed the earnings structure by narrowing down the lineup and improving the efficiency of operational and developmental systems. As a result, earning power dipped temporarily in the fiscal year ended March 31, 2014.
- In the comics, animations, and movies/TV fields, we continued deploying management resources with a view to creating and cultivating IP such as characters and stories, which are the source of growth. In particular, we animated works created through comics and strengthened sales promotion activities.
As a result of the above-mentioned measures and advance investments aimed at medium-to-long-term growth, operating income decreased 5.1% year on year.
4 Shareholder Return
The Group considers increasing corporate value to be a crucial management issue and follows a basic policy of paying appropriate dividends commensurate with profits realized. Specifically, dividends are determined based on such benchmarks as the Company’s cash flow situation. In general, however, we use a consolidated payout ratio of 20% or higher as a benchmark. With regard to internal reserves, our policy is to use them effectively in investments intended to strengthen our financial position and management base and ensure continued business expansion and competitiveness.
In view of the above, dividends paid for the fiscal year ended March 31, 2014, consisted of interim dividends of ¥25* per share and year-end dividends of ¥25 per share, giving total dividends for the year of ¥50 per share. The consolidated payout ratio was 30.9%.
In the fiscal year ending March 31, 2015, we plan to pay interim dividends of ¥25 per share and year-end dividends of ¥25 per share, giving total dividends for the year of ¥50 per share.