Review of Fields’ Business Activities
Market Trends
Market Trends: Leisure
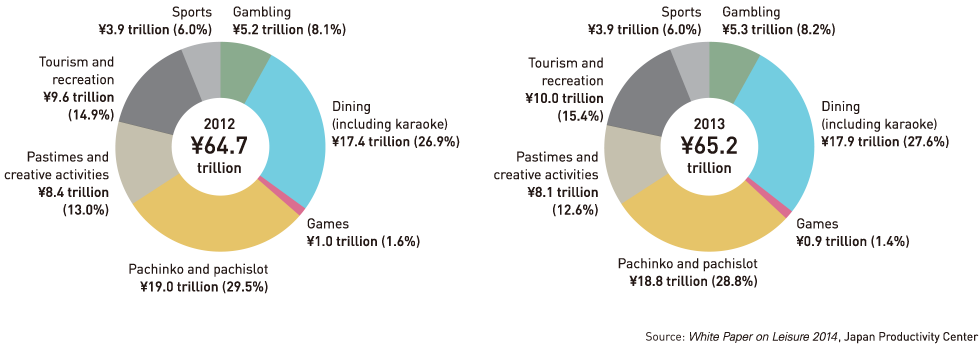
According to the Japan Productivity Center’s White Paper on Leisure 2014, the leisure market edged up 0.8% year on year, to ¥65,216.0 billion in 2013. Growth was particularly strong in the tourism and recreation sector, which grew approximately 4% year on year, to ¥10,022.0 billion. This reflected theme and amusement parks’ record revenues and a significant increase in domestic tourism, which offset lower overseas tourism resulting from the yen’s depreciation. An additional factor driving growth was a rush in demand before a consumption tax increase in April 2014.
Source: White Paper on Leisure 2014, Japan Productivity Center
Furthermore, the smartphone market, which is not included in the White Paper on Leisure 2014, expanded significantly in 2013, growing 78.0% year on year, to ¥546.8 billion. The native app market increased 137.2% year on year, to ¥317.8 billion. This was attributable to more titles in all genres, from quiz and puzzle games through to full-fledged role-playing games (RPGs), and endorsement not only from core users but from a wide range of users. The web app market grew 32.2% year on year, to ¥229.0 billion, due to continuing strong support as core users switch from feature phones to smartphones.
Sources: Japan Online Game Association and Joint Survey by CyberZ, Inc., and Seed Planning, Inc.
Leisure Market
Market Trends: Content Industry
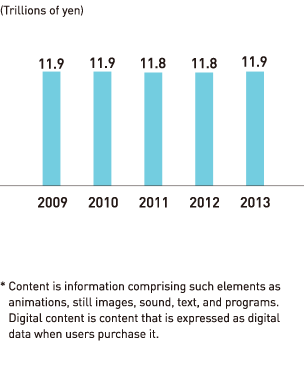
According to the Digital Content Association of Japan’s White Paper on Digital Content 2014, in 2013 the content industry’s market – comprising Japan’s movies, animes, TV shows, games, and books – was approximately unchanged year on year, edging up 0.4%, to ¥11,909.4 billion. Looking at content by category year on year, animations and games increased, while music and sound and still images and text decreased.
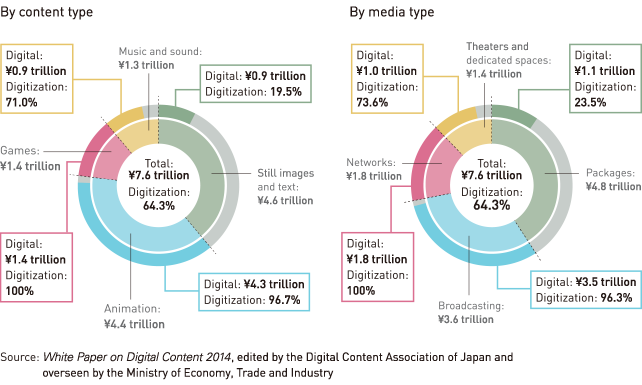
Furthermore, the shift from analog to digital continued. The digital content market rose steadily, increasing 1.6% year on year, to ¥7,658.9 billion, which accounted for 64.3% of the overall content market. By content type, the animation market generated revenues of ¥4,334.8 billion, representing 56.6% of the content market. Apart from music and sound, animations, games, and still images and text each grew year on year.
Content Market*
Digital Content Market*
Market Trends: Pachinko and Pachislot
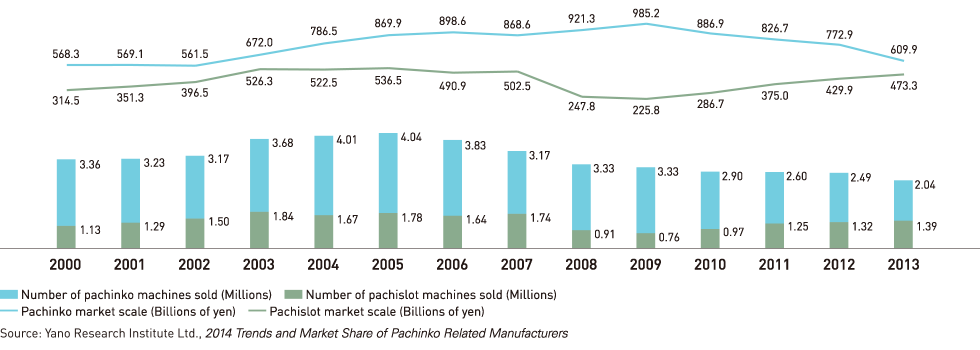
Based on ball and token rental fees, in 2013 the pachinko and pachislot market declined 1.3% year on year, to ¥18,818.0 billion. However, this market continues to account for a significant share of the leisure market.
Although the number of pachinko halls in Japan decreased 2.1%, to 11,893, pachinko and pachislot machine installations rose for the forth consecutive year, to 4.61 million units. Thus, the number of machines installed per pachinko hall continues to trend upward.
Pachinko machine sales were down 440,000 units year on year, to 2.04 million units, while pachislot machine sales rose 60,000 year on year, to 1.39 million units. As a result, pachinko machine sales decreased 21.1%, to ¥609.9 billion; pachislot machine sales increased 10.1%, to ¥473.3 billion; and the total sales market declined 9.9%, to ¥1,083.2 billion.
In the pachinko and pachislot market, the importance of content is increasing. Titles incorporating content from animes and movies/TV shows account for the majority of the market.
Sorce: Yano Research Institude Ltd., 2014 Trends and Market Share of Pachinko Related Manufacturers
Scale of the Machine Sales Market (based on sales price)