Review of Fields’ Business Activities
Financial Position
Consolidated Financial Highlights
Millions of Yen
| At March 31, 2012 | At March 31, 2013 | At March 31, 2014 | Change | ||
|---|---|---|---|---|---|
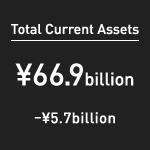
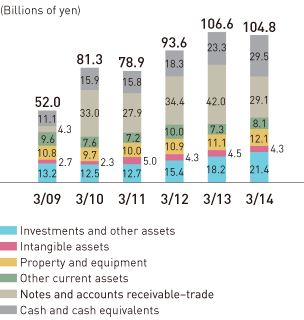
| Total current assets | 62,811 | 72,709 | 66,921 | (5,788) | ( 1 ) |
| Property and equipment, net | 10,980 | 11,151 | 12,104 | 953 | |
| Total intangible fixed assets | 4,372 | 4,540 | 4,365 | (174) | |
| Total investments and other assets | 15,437 | 18,226 | 21,477 | 3,251 | ( 2 ) |
| Total fixed assets | 30,790 | 33,918 | 37,948 | 4,029 | |
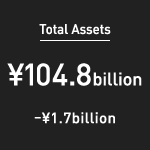
| Total assets | 93,601 | 106,628 | 104,869 | (1,758) | |
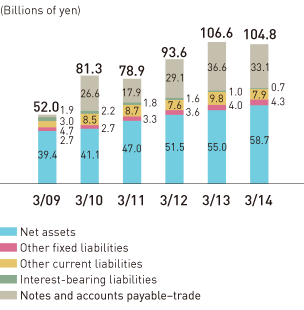
| Total current liabilities | 37,925 | 47,365 | 41,730 | (5,635) | ( 3 ) |
| Total long-term liabilities | 4,121 | 4,164 | 4,386 | 222 | |
| Total liabilities | 42,046 | 51,529 | 46,116 | (5,413) | |
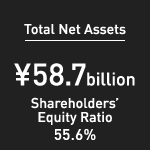
| Total shareholders’ equity | 51,895 | 54,957 | 58,670 | 3,712 | |
| Minority interests | 483 | 539 | 473 | (65) | |
| Total net assets | 51,555 | 55,098 | 58,753 | 3,654 | ( 4 ) |
| Total liabilities and net assets | 93,601 | 106,628 | 104,869 | (1,758) |
Financial Analysis
Assets
Total current assets at March 31, 2014, stood at ¥66,921 million, down ¥5,788 million from March 31, 2013 ( 1 ). This was mainly attributable to a ¥12,861 million decrease in notes and accounts receivable-trade, to ¥29,155 million, which reflected lower receivables associated with sales of pachislot machines. Property and equipment, net was ¥37,948 million, up ¥4,029 million. This primarily resulted from a ¥3,251 million rise in total investments and other assets, to ¥21,477 million, due to investments in capital of subsidiaries and affiliates ( 2 ).
As a result of the above, total assets at March 31, 2014, amounted to ¥104,869 million, a decrease of ¥1,758 million from March 31, 2013.
Assets
Liabilities
Total current liabilities at March 31, 2014, amounted to ¥41,730 million, a decreased of ¥5,635 million from March 31, 2013 ( 3 ). This was principally due to a ¥3,498 million decline in notes and accounts payable-trade, to ¥33,105 million, reflecting lower payables associated with sales of pachislot machines, and a ¥1,971 million decrease in income taxes payable, to ¥1,959 million.
As a result of the above, total liabilities at March 31, 2014, amounted to ¥46,116 million, a decrease of ¥5,413 million from March 31, 2013.
Total net assets at March 31, 2014, were ¥58,753 million, an increase of ¥3,654 million from March 31, 2013 ( 4 ). This was mainly because of a ¥3,712 million rise in retained earnings, to ¥44,548 million, which resulted from higher net income.
Liabilities and Net Assets
Cash Flows
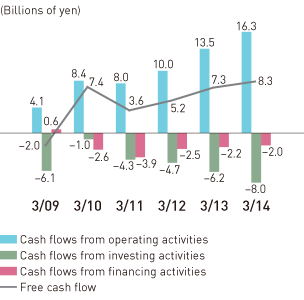
Consolidated Cash Flows
Millions of Yen
| At March 31, 2012 | At March 31, 2013 | At March 31, 2014 | |
|---|---|---|---|
| Net cash provided by operating activities | 10,015 | 13,570 | 16,322 |
| Net cash used in investing activities | (4,798) | (6,263) | (8,018) |
| Net cash used in financing activities | (2,565) | (2,277) | (2,018) |
| Foreign currency translation adjustments on cash and cash equivalents | 0 | (3) | 0 |
| Net increase in cash and cash equivalents | 2,652 | 5,025 | 6,284 |
| Cash and cash equivalents at beginning of the year | 15,632 | 18,284 | 23,309 |
| Cash and cash equivalents at end of the year | 18,284 | 23,309 | 29,583 |
Cash Flows from Operating Activities
Net cash provided by operating activities amounted to ¥16,322 million, compared with ¥13,570 million in the previous fiscal year. The principal factors were ¥9,588 million in income before income taxes and minority interests, a decrease in notes and accounts recievable-trade of ¥13,078 million, a decrease in accounts payable-trade of ¥3,132 million, and income taxes paid of ¥5,929 million in depreciation and amortization.
Cash Flows from Investing Activities
Net cash used in investing activities amounted to ¥8,018 million, compared with ¥6,263 million in the previous fiscal year. The principal factors were expenditure for acquiring other securities of subsidiaries and affiliates of ¥3,000 million, purchases of property and equipment of ¥2,035 million, and purchases of intangible assets of ¥1,414 million.
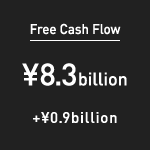
Free cash flow, the sum of cash flows from operating activities and cash flows from investing activities, amounted to ¥8,303 million, compared with ¥7,307 million in the previous fiscal year.
Cash Flows from Financing Activities
Net cash used in financing activities amounted to ¥2,018 million, compared with ¥2,277 million in the previous fiscal year. The principal factors were cash dividends paid totaling¥1,657 million, redemption of corporate bonds totaling ¥300 million, and repayment of long-term borrowings totaling ¥122 million.
Free Cash Flow